
May 9, 2019
Last updated
min read
With the explosion of datasets available to optimize location strategy in commercial real estate, things can get quite confusing. In this post, I’ll share why commercial real estate datasets multiplied after 2007, how they all boil down to four types. In part two of this post, I’ll get into the how, when and why to use each.
Commercial real estate, although relatively slow to adopt new technology has seen some dramatic shifts in the past 20 years. The ‘90s was the era of “boots on the ground” research. In the 2000’s we started modeling demographics to assist decisions. In 2007 Apple introduced the iPhone, and GPS capability the next year. Over time the smartphone category as a whole became ubiquitous, essentially putting censors in everyone's pockets. This is the critical turning point that led to the proliferation of new data sources. Good for commercial real estate, but admittedly confusing.
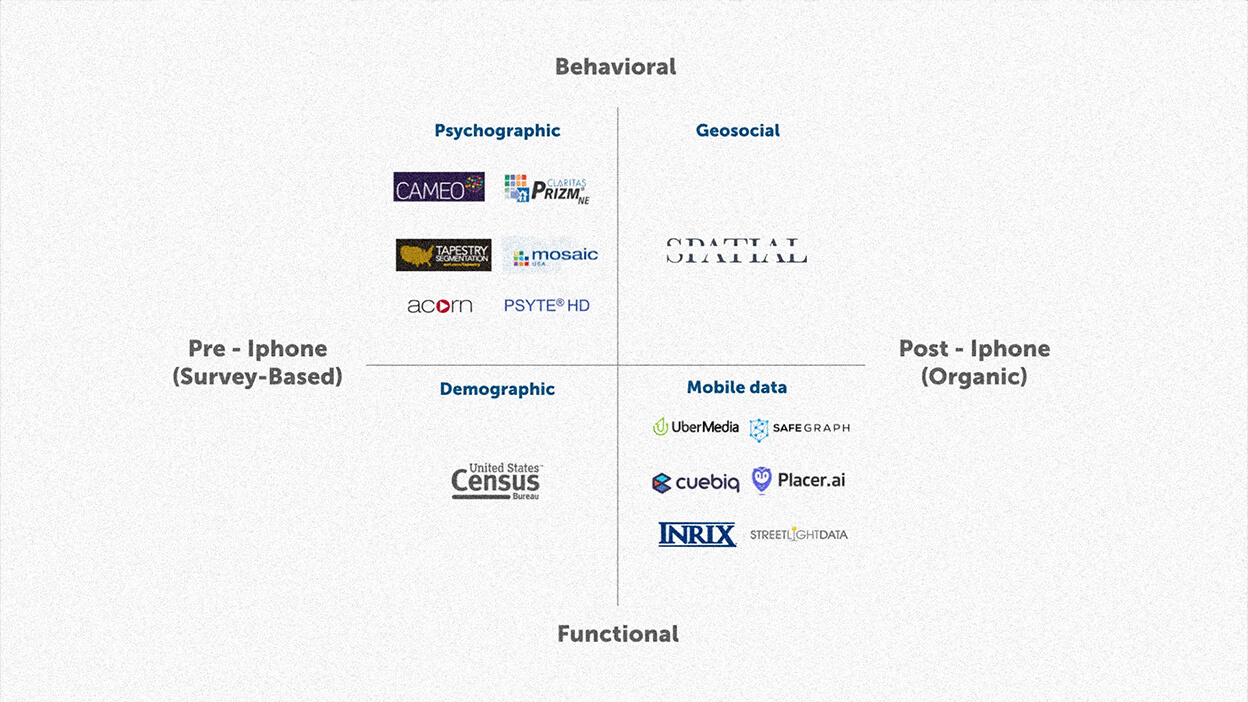
A helpful way to think of the data landscape is visualizing a quadrant. From functional (age, income, etc.) to behavioral (mindsets and attitudes). And from Pre-iPhone (static, survey-based) to Post-iPhone (dynamic, organic). It is important to point out that no section of the quadrant is superior.
We will start on the left side (Pre-iPhone) for now.
Functional datasets focus on facts about people like age, income, etc. The main objective is to show the who and what behind trade areas.
An example of a functional datapoint is “This neighborhood contains a population of 100,000”.
Behavioral information shows the mindsets, attitudes, and interests of a population. The main objective is to show the who and why behind trade areas.
An example of a behavioral datapoint is “People in this income range like to go jogging”.
Datasets on the left side of the quadrant are all built on census data. A survey-based method of collecting data. In the nineties, the industry realized they needed a better way to understand demographics, so companies paired behavioral survey questions with demographics. This became Psychographics (called “geodemographics” in Europe).
The datasets so far show static data about people in a fixed location. But humans are dynamic creatures and move about a majority of our lives. The left side misses a large part of the story. The launch of the iPhone unwittingly created a dynamic shift that allowed companies to capture the movement of consumers.
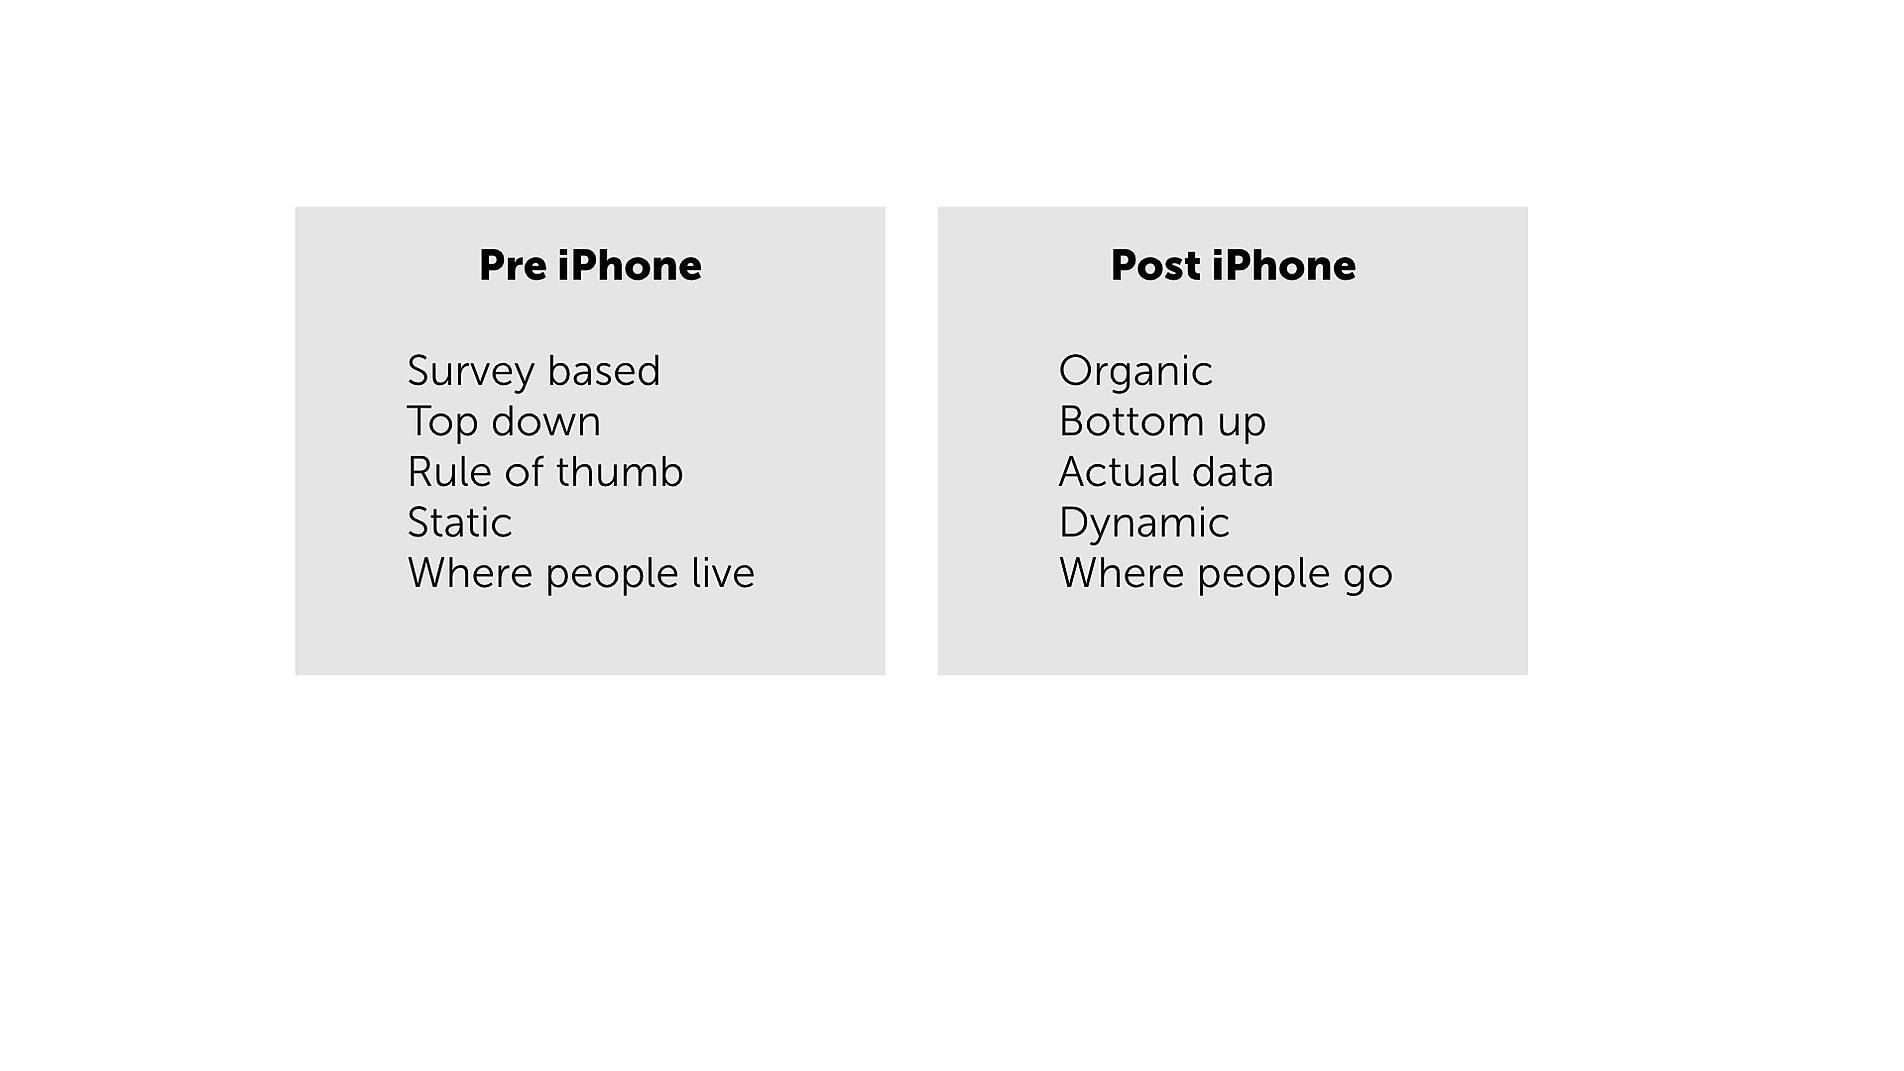
Pre-iPhone datasets are mainly built on census data and survey information. The main point is to show functional or behavioral information on where people live.
Post-iPhone datasets are built on location data generated from mobile devices. The main point is to show dynamic information on where people go.
An example of Post-iPhone and Functional data point is: “Device X visited this Wendy’s yesterday”.
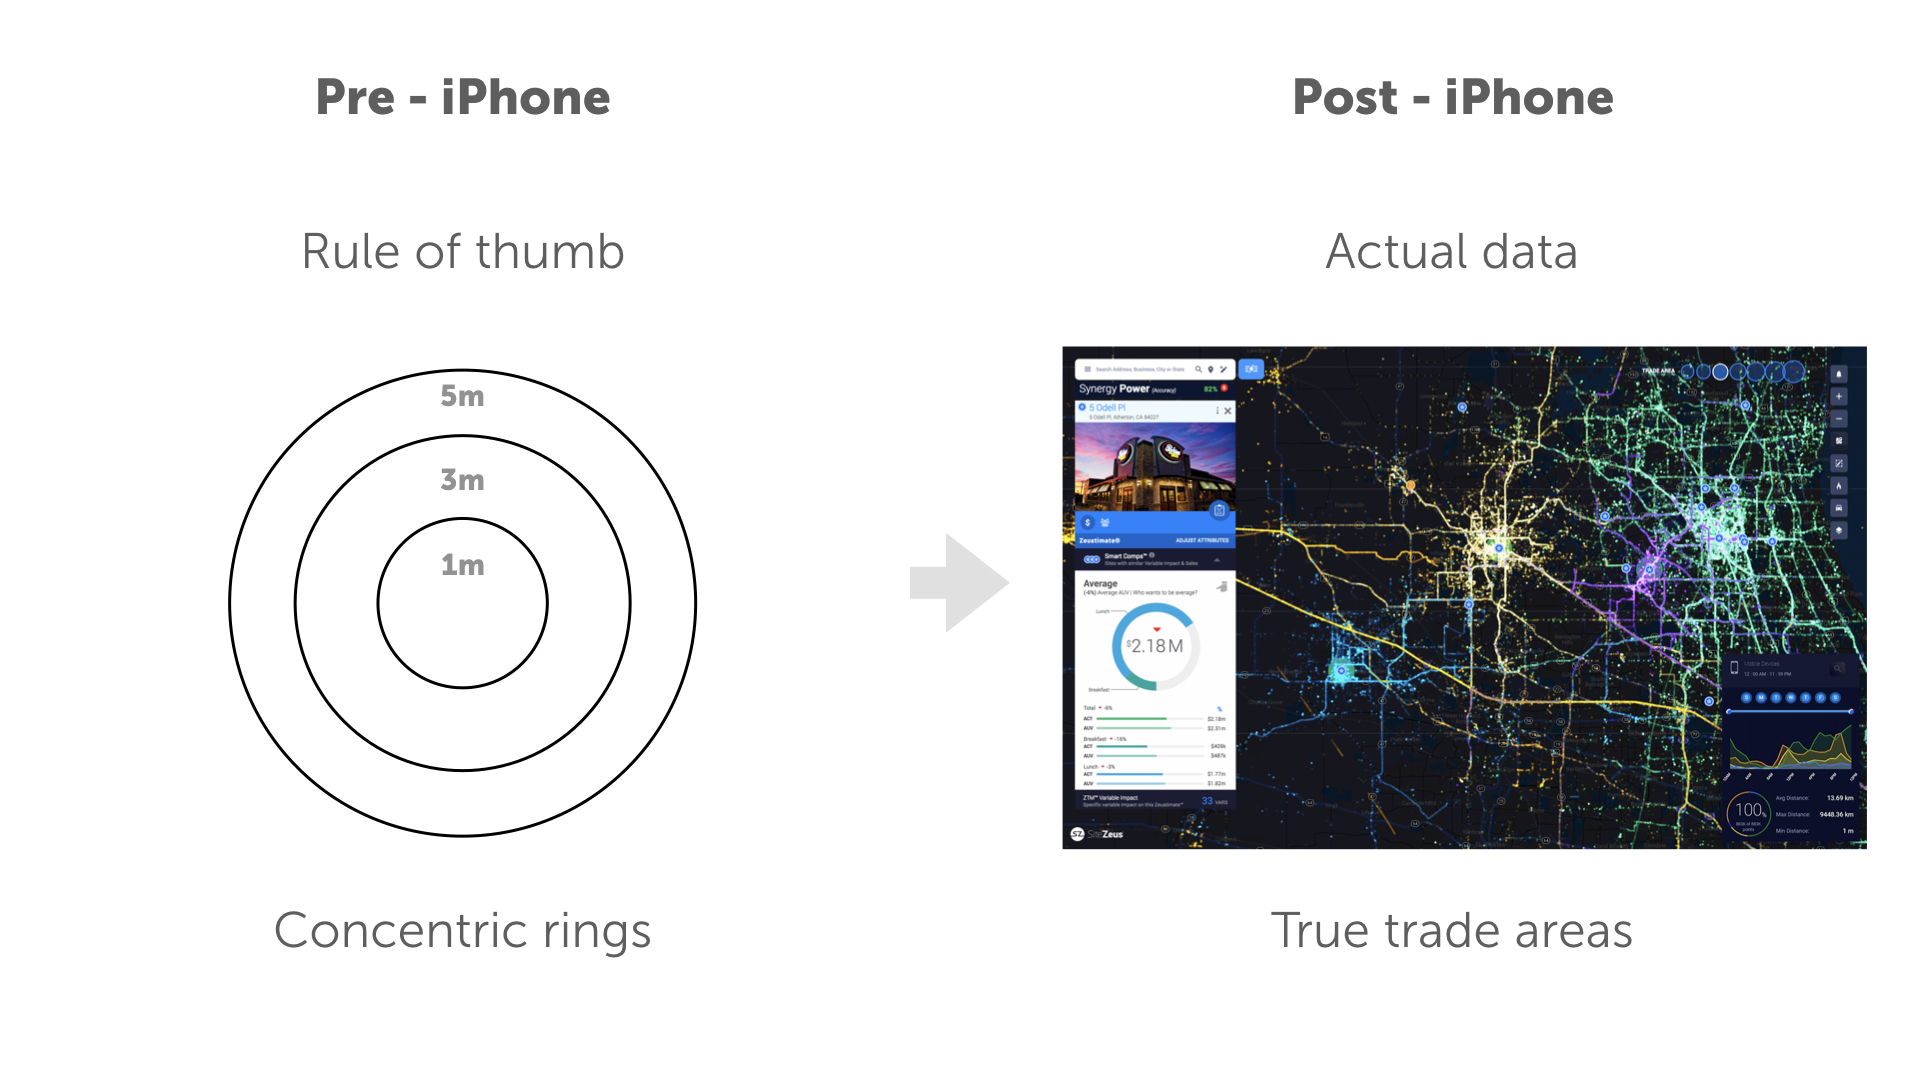
Movement data from cell phones allows retailers and other companies to track anonymized devices through space and time. An illustration of one way this has become useful is understanding the dynamic nature of trade areas by shifting the thinking from a “rule of thumb” 1, 3, 5 mile radius to a real trade area using actual data collected from mobile devices. The right side shows our partner SiteZeus platform.
What is the Post-iPhone equivalent to behavioral data? The collision of mobile data and social media has opened up this possibility. Geosocial data is created from billions of location-based social media conversations organized into 72 segments. It is similar to psychographic segmentations in that is behavioral, but different in that it is based on actual conversations happening in area vs. rule of thumb survey questions.
An example of a Post iPhone behavioral datapoint is “This neighborhood around this shopping center shows proportionally high interest in girl’s night out activity”.
An illustration of one way this has become useful is understanding the social nature of trade areas by shifting the thinking from a “rule of thumb” psychographic bucket - to using actual behavioral data collected from social media coming from mobile devices. The right side show’s our partner SiteZeus platform.
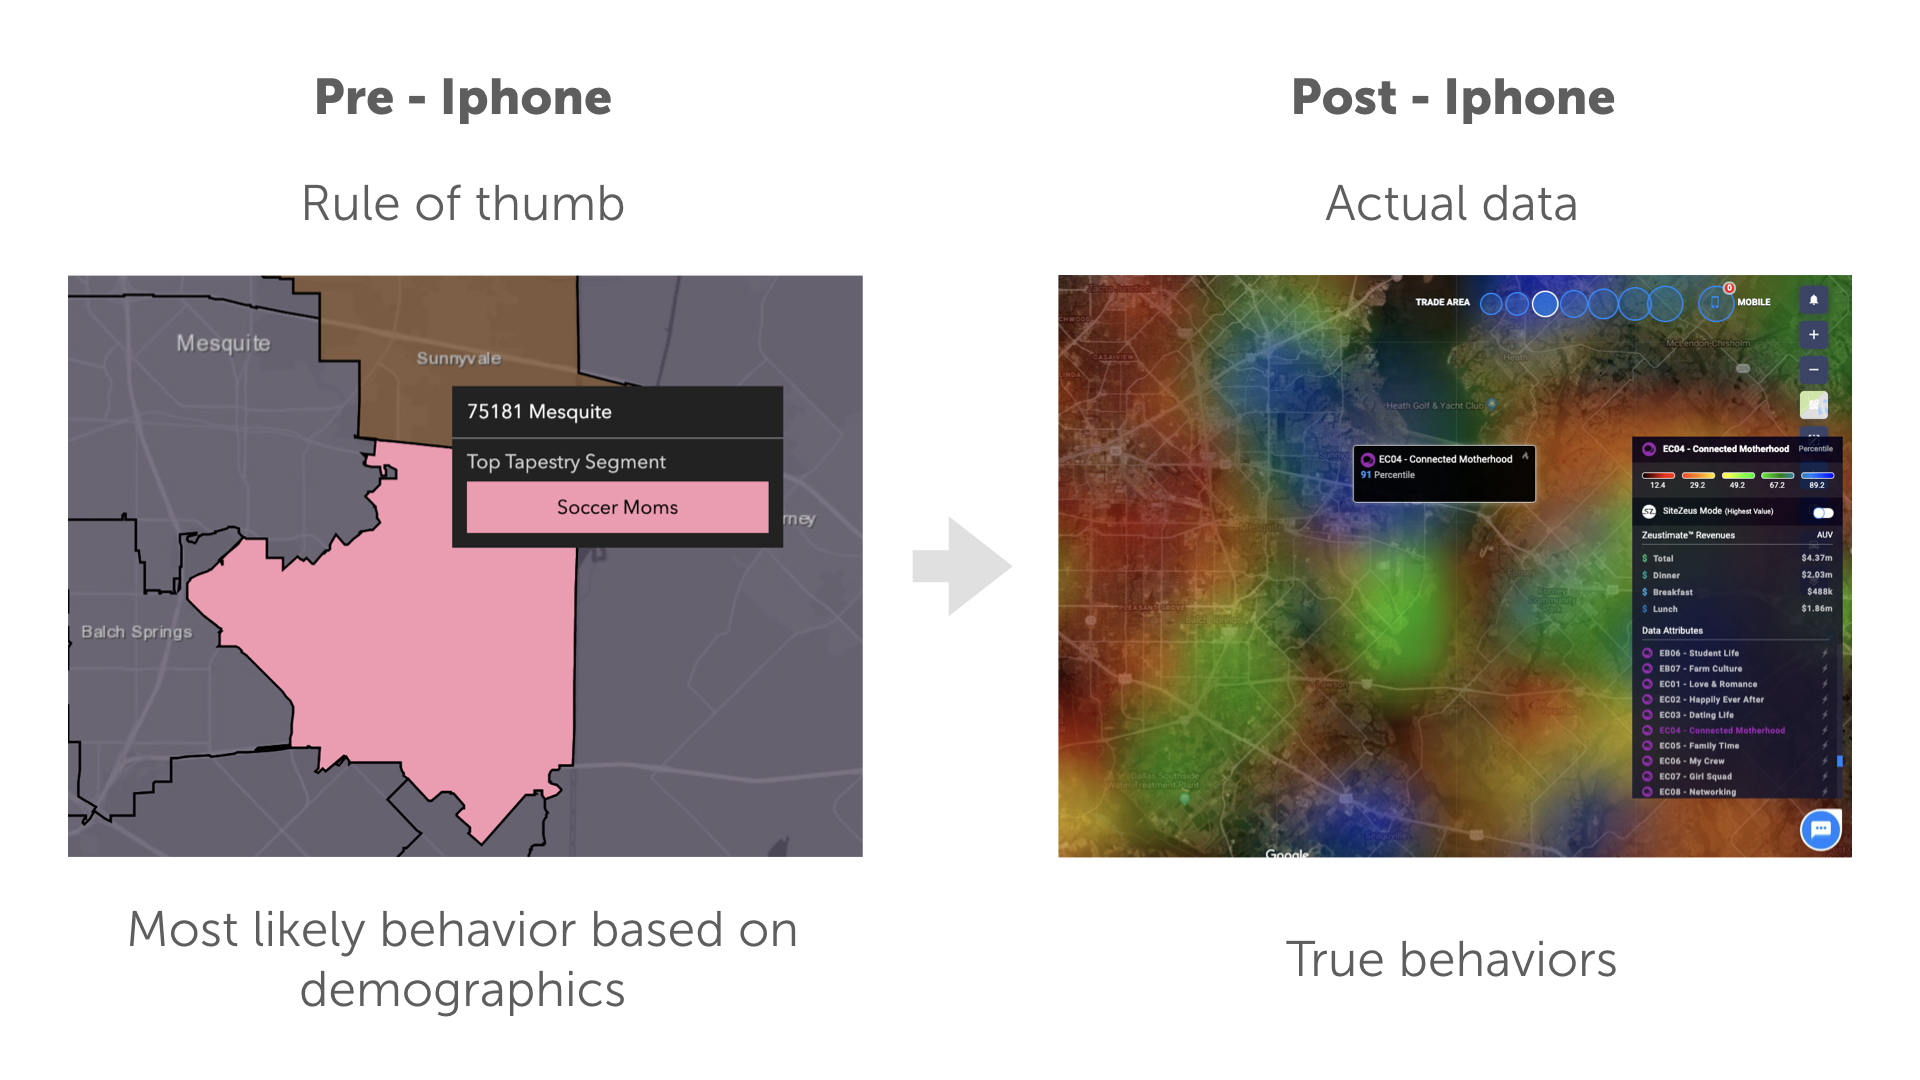
These are the same areas in Mesquite, Texas. Psychographic data would bucket the area into the “soccer moms” segment based on the demographics of the area. On the right-hand side you can see the Geosocial segment “Connected Motherhood”, the northern part of this zip code does score highly for “Connected Motherhood” but all other areas score quite lowly for this behavior. Using just the psychographic data would be missing a big part of the picture.
In both cases, no survey data are used to make these datasets. They are created bottom up vs. top down. No human intervention allows the data to speak for itself. Mobile data is generated from the organic movement of cell phones and gives us actual movement vs. rule of thumb drive time or concentric rings. Geosocial data is created by allowing a machine to cluster conversations that naturally arise and gives us actual behavioral data on an area vs. rule of thumb assumptions based on the demographics.
Obviously, none of these data sources are superior to each other. The key is to know what questions each of them are best designed to answer. That will be the focus in part two of this post.

.jpeg)
.jpeg)
.jpeg)