3 Ways To Segment Foot Traffic Data

Foot traffic data, generally hailing from cell phones, has changed the way businesses understand their customers across industries. And while it’s gone through its share of challenges, this data is here to stay. Companies like Near, Placer.ai, SafeGraph, and more are leading the charge in making this data easily available.
Foot traffic data has proven to be very useful. But its uses are generally limited to 2 things:
- Identifying a true trade area around a retail location
- Estimating and tracking foot traffic
We know that, in reality, not every visit is valued equally. If it were possible to understand the people behind the devices it would massively unlock the true value of foot traffic data. While this data does an excellent job of answering the where aspect of your visitors, foot traffic data alone is missing the who. Using segmentation systems is the easiest way to understand who your visitors (aka customers) are.
In this post, we will explain three ways to match foot traffic data to consumer segmentation systems (also called geodemographic and psychographic segmentation). We will then take a look at a segmentation report for Nashville Zoo and consider how we might use that information. The analysis you are about to see is done instantly on the PersonaLive platform.
Matching Method 1: Dominant Segment
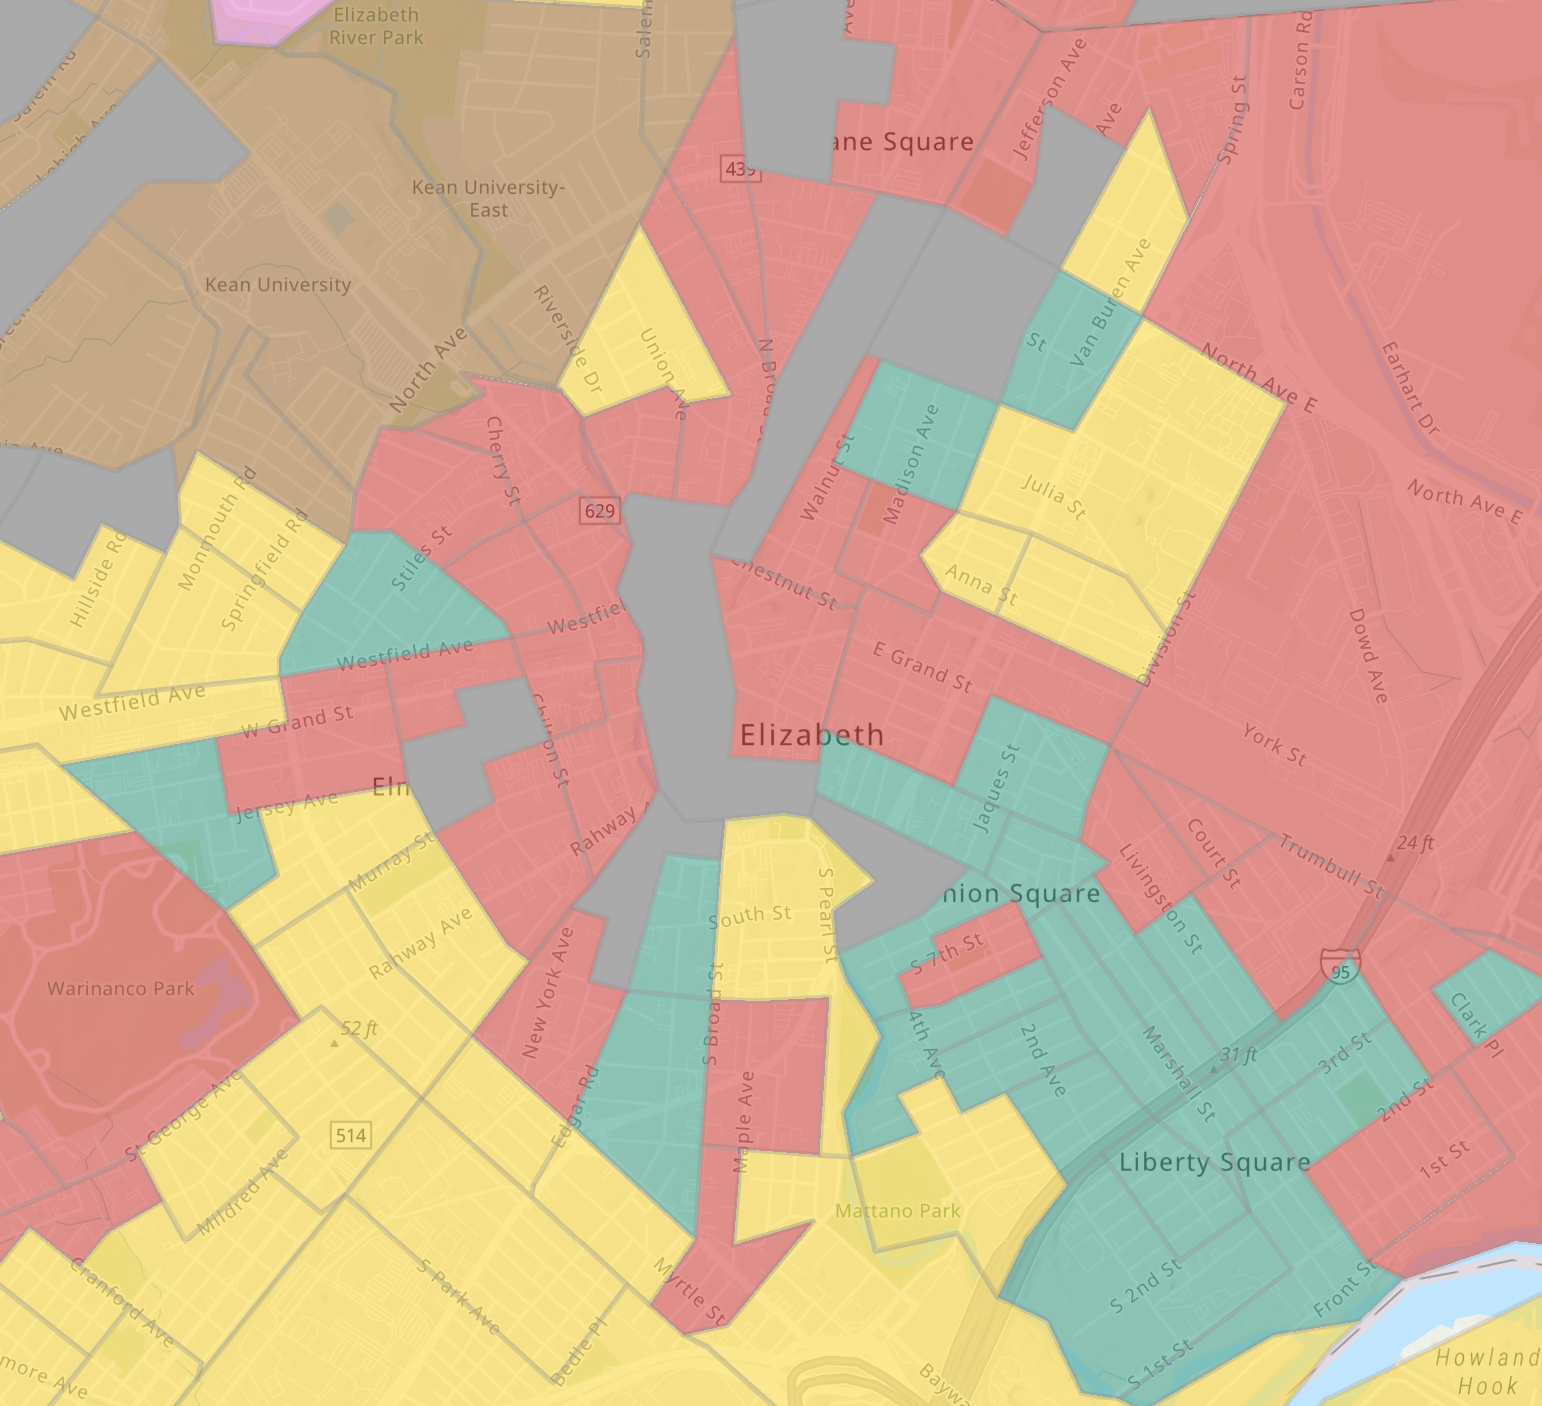
The simplest way to segment a visitor is to determine the dominant segment in the area in which that customer lives. You can do this using the Common Evening Location or Home Location of the visitor, which comes with most mobility datasets. You then assign that customer to the most common segment in the area. In most cases, this means that their home location latitude and longitude will be matched to a zip code, census block group (CBG), or, more specifically, zip+4.
When aggregating this data across all visits to your physical location, you can simply add up the visits attributed to each segment.
This approach is the simplest and performs well, even when compared to more advanced approaches. Typically, this will be done at the census block group or zip+4 level. Zip code is just not as granular.
Matching Method 2: Weighted Distribution
A way to improve upon the simple “Dominant Segment” approach is to use the distribution of segments in an area to more intelligently attribute visits. For example, assume we had 10 visits to our store from block group 390610007003 (downtown Cincinnati). If we know that this block group is made up of 30% G01 - #Highrisers and 70% H02 - #RisingProfessionals, then we’ll attribute 3 visits to segment G01 and 7 visits to segment H02.
In reality, there can be many different types of households in a neighborhood. Using the distribution of segments (rather than just the dominant one) in an area may improve analysis results.
When using this approach across all visits to your location, you can sum up the percentage of each segment in each geography (zip code, CBG, zip+4) weighted by the number of visits that originated in the given geography. The resulting number more intelligently segments customers than Method 1 above.
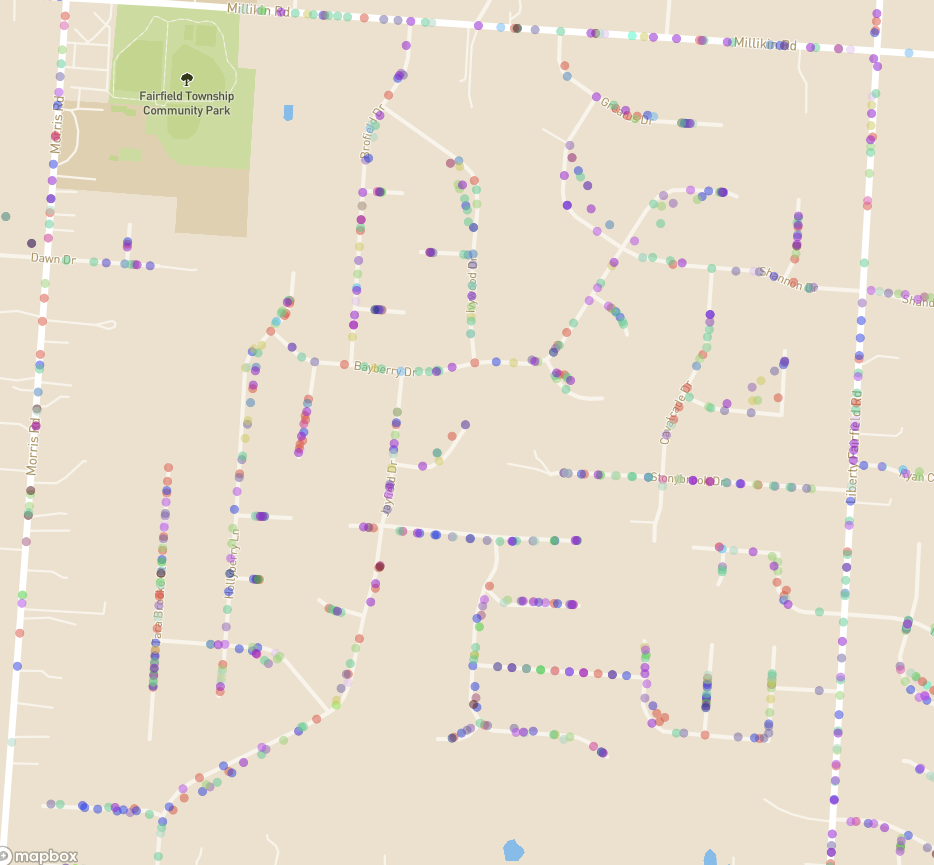
Matching Method 3: Nearest Neighbor/Household
Both Methods 1 and 2 above can be used even without latitude and longitude if you have information like the zip+4, census block group, or even census tract for your visits. However, for Method 3, latitude and longitude (or address) are necessary.
Some USA segmentation systems can individually segment the majority of households in the country. For example, both Experian’s Mosaic and our (Spatial.ai’s) PersonaLive datasets can do this. With that large database of consumers, another approach for segmenting mobile data is to use the physically nearest household to the common evening location of each visitor. This approach combines simplicity with data scale to create an approach that may be an improvement on Methods 1 and 2.
In this approach, when aggregating this data across all visits to your location you can simply add up the visits attributed to each segment.
While the nearest neighbor approach has some clear advantages, especially if the alternative is to use geographies as large as zip codes or census tracts, it is not without drawbacks. Not all mobile data providers will provide a latitude and longitude coordinate for visitors. Additionally, even if they do, in many cases that coordinate is “jittered” (that is, shifted a random distance in a random direction) for privacy and to prevent certainty of someone’s identity. This jittering can damage accuracy, though not enough to invalidate the nearest neighbor approach.
Which method is best?
The answer, of course, is that it depends. Each approach has advantages and disadvantages and will depend on the data you have access to. Sometimes you may only have data on the zip code of visitors. Whereas in some situations you may know visitors’ home locations down to the latitude and longitude coordinates.
In our experience, block group level matching, which is more specific than zip code or census tract, performed using Methods 1 or 2 adds a ton of value to foot traffic data. If doing more specific zip+4 matching or nearest neighbor is possible, you may be able to gain a performance improvement over that baseline.
Getting Value From Segmented Foot Traffic Data
When you segment foot traffic data using Spatial.ai, we’ll provide you with a customized report to help you get the most out of your data. Let’s take a look at an example report output. In this case, we’re looking at results for the Nashville Zoo. A customer uploaded this data and we automatically generated this report in less than two minutes (just so you know 😉).

Data Summary
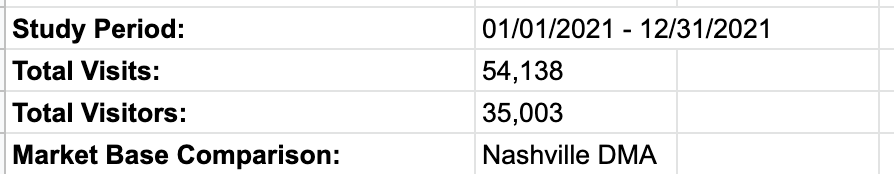
Reports start off by summarizing the contents, including a study period, total visits, total unique visitors, and a market base. The market base is automatically generated and represents the population being used for comparison. If 7% of visits come from the M04 - #Kids&Country segment but 9.5% of households in Nashville are classified this way, then the M04 - #Kids&Country makes up a large portion of visitation but is actually low compared to the market base.
Top Segments and Families by Visitation
PersonaLive (like most other segmentations) is made up of segments and families. Each of the 80 segments belongs to one of 17 families. Reports include a look at the most commonly visiting families and segments.
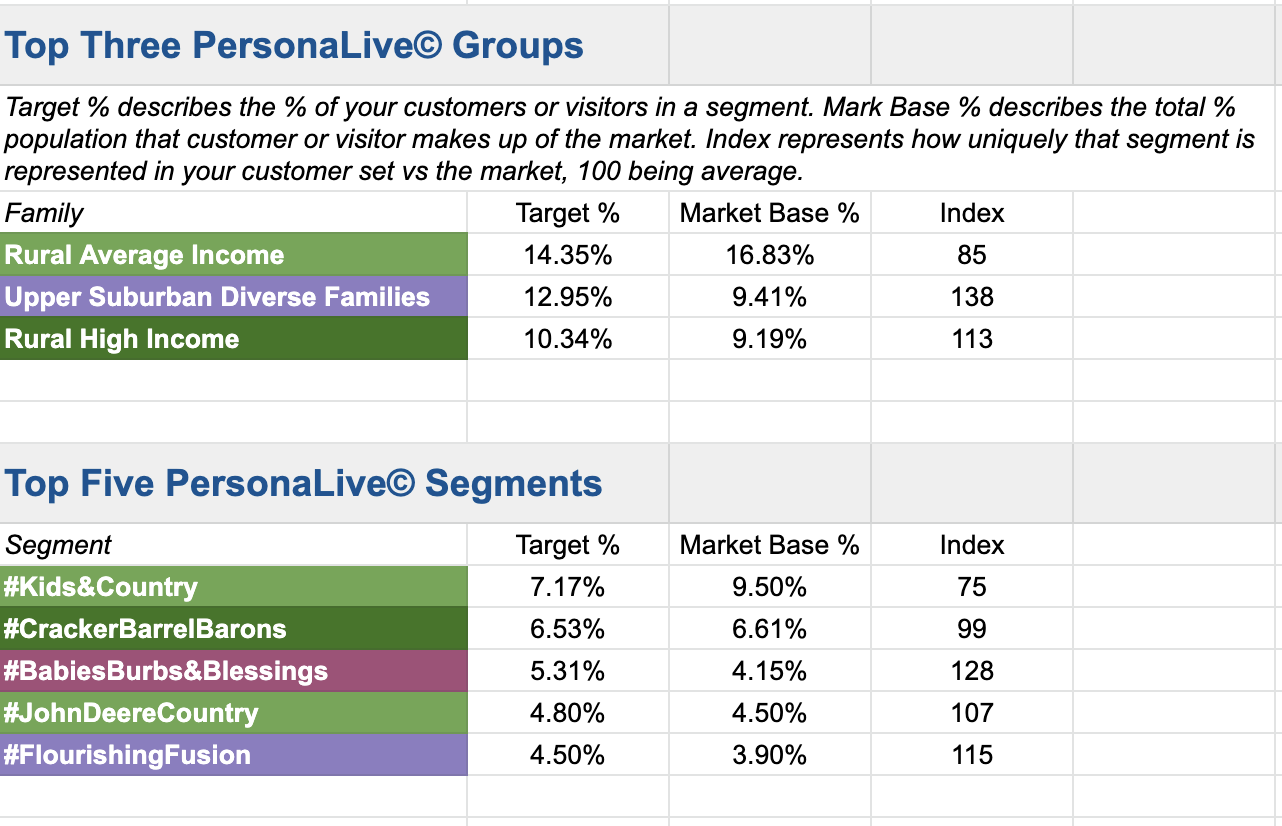
In this case, the Nashville Zoo has the highest percentage of visitation from rural segments. However, this visitation is relatively in line with the market itself.
- Target %: The percentage of mobile visits from this segment.
- Market Base %: The percentage of the population in the trade area for this segment.
- Index: Likelihood for that segment to visit vs. the average person in the market. For example 100 is average and 125 is 25% more likely.
We see that B04 - #BabiesBurbs&Blessings represent 5.31% of the visits and only 4.15% of the market base. They have an index of 128. That means they are 28% more likely to show up at the zoo. Nashville Zoo may want to consider targeting this segment with advertising in the DMA.
Top Segments and Families by Frequency
Foot traffic data can also give insight into visit frequency, identifying the types of people who show up more than once.
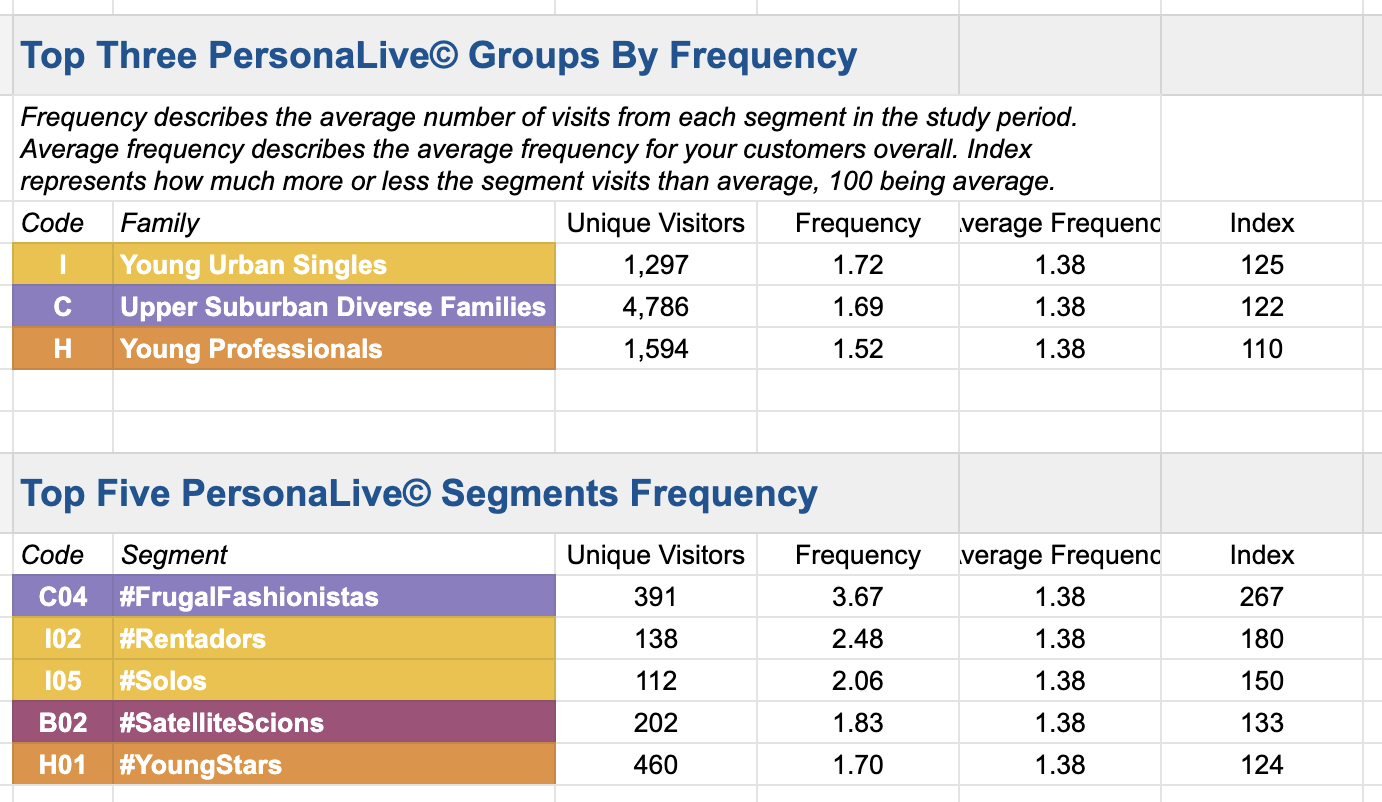
For Nashville Zoo, while rural visitors make up a higher percentage of visits, younger people and diverse families are more likely to visit more than once.
Implications
There are a wide range of implications once you understand the types of people more likely to visit a location:
Site Selection: If you identify 2-3 segments that consistently over-index on visiting your locations vs. the market you can begin locating stores near these segments.
Tenant Selection: Once you know the segments visiting a shopping center, you can rank the top brands visited by the segment to identify the brands that would perform well.
Target Marketing: Using the Audience Builder you can target ads or send direct mail to the individuals in that segment near your locations.
Loyalty Marketing: We found C04 - #FrugalFashionistas visits the Nashville Zoo almost four times a year vs. one time for the average visitor. Spend more on these people with a higher LTV.
Personalization: Send different imagery and deals to a segment like H01 - #YoungStars (who are young and single) versus M04 - #Kids&Country (who are rural families).
Conclusion
We discussed three ways to match foot traffic data to segmentation, showed you a real report combining foot traffic with segmentation data, and listed five ways to leverage those insights for higher ROI.
Foot traffic data is powerful. But being able to know who is behind those visits, what marketing to show, and where to target takes you beyond simple foot traffic. It transforms your foot traffic data from an insight tool to a profit center.
What you should do now
Whenever you're ready, here are 3 ways Spatial.ai can help:
- See PersonaLive In Action. If you'd like to segment and target your best customers using real-time behavioral data, schedule a free 30-min demo to get started.
- Subscribe To Consumer Code. If you've found this helpful, check out our newsletter and podcast where we share more consumer research and insights for retail marketers.
- Share This Post. If you know another marketer who’d enjoy reading this post, share it with them on Linkedin, X, or Facebook.
Get retail marketing tips
We email every monday with smart growth strategy ideas. Almost no promotion. Just value.

.avif)
%20(1).jpg)