The X Factor for Banking Site Selection

Context
The banking industry has changed dramatically in the last ten years. Online banking and alternatives to traditional banks have become more popular. For a thorough overview of the changes that have occurred and how banks are responding, read the article The Future of Brick & Mortar Banks.
These changes are not unlike the challenges encountered by retailers. Technology is forcing these industries to adapt and “right-size” the number of physical locations. As banks adjust their strategy and continue to open new branches, whether it’s JP Morgan’s 400 branch expansion or Capital One’s “Banks for Millennials”, they must minimize any room for error. As we have outlined previously for retailers, banks must adopt the latest site selection and real estate practices to avoid failing branches.
Traditional Modeling and Variables
The key to effective site selection for banks, similar to retailers and restaurants, is identifying the strengths and weaknesses of a trade area. This is traditionally done with demographic data. This overview from ESRI highlights the typical approach to analyzing demographic data to identify successful bank sites. According to ESRI and banking real estate thought leaders we have interviewed, the key criteria usually come down to income (banks often use this for measuring “demand” for financial services in a community) and population.
What this demographic data and other available information has been unable to explain is why two banks with demographically similar communities can perform so radically different. This leads to one bank thriving, and the other failing. This loss becomes even more painful when banks are unable to understand why one location failed.
Now, banks are beginning to use Geosocial Data to measure the difference between success and failure for new sites. In this case study, we use publicly available data to quantify the impact of Geosocial data on banking real estate decisions.
Intro to Geosocial Data
Geosocial data is location-based social media data that can be interpreted and analyzed as part of any location-oriented business decision. Geosocial data is often used in the retail, commercial real estate, consumer goods, advertising, and residential real estate industries. The data is used because it has been proven to be useful in predictive models in these industries for forecasting business performance. This is because it captures so many other variables about the behaviors of a community that household demographics and survey-based projections miss. For banks, this is of vital importance, because the data can signal activity relevant not just for retail banking accounts, but for commercial and private banking performance.
The Geosocial data is available in social segments. These segments represent behaviors that are observable everywhere in the U.S. and Canada. For every single community, all of these behaviors are measured against a benchmark based on the real activity occurring in the area. For example, if a trade area for a bank scores a 72 for the segment Wealth Signaling, it means that the behavior is more common in that area than it is in 72% of communities across the U.S. If it is determined that Wealth Signaling has a positive impact on banking deposits, this score would be a positive indicator for success.
Traditionally, banks rely on information from the census (most recent one is from 2010). This data can help them understand basic information, but if two people both earn around the same income and are demographically similar, they are treated like they are the exact same person. This is not the case with Geosocial data. Not only is this data more recent (up-to-date to the most recent quarter), but it is also data captured directly from the experiences people are engaging in and sharing. Instead of categorizing two people as the same based on their demographics, the data measures how a community actually behaves
Further reading: The Essential Guide to Geosocial Data
Approach
Our hypothesis for this case study was that by using Spatial.ai’s social segmentation (which can be explored in our Segment Taxonomy) of Geosocial data in addition to traditional demographic variables like income, demand, and population density, we would be able to better predict deposits at bank branch locations. Further, Geosocial data would provide context on the behaviors and activities important to individual banks.
Performance Data
In the U.S., all banks must report the amount of deposits they receive, in total and by bank branch, to the Federal Deposit Insurance Corporation, aka the FDIC. This data is then made publicly available; this is a big deal because this is valuable data. Deposit numbers are a reliable indicator of how well banks are performing, both at a specific and aggregate level. We chose to use this data as our target variable. This data can found here.
Cleaning & Processing the Data
There are a lot of things to consider when dealing with a modeling problem this big. The initial dataset of bank branches contains 88,063 bank branches, all told representing about 5000 different banks. This data contains the entire landscape of banking in the US. It spans banks with 5000 locations down to regional all the way down to banks with one location.
For this case study, we chose to focus on the brick & mortar locations for Capital One, JPMorgan Chase, PNC, TD Bank, U.S. Bank, and Wells Fargo.
To make our model as useful and applicable as possible, we took a number of steps to clean it into a usable dataset from which we could draw valuable insights. The following lists details a few of the steps we took:
- Limited data to include only full service, brick & mortar bank locations
- Removed headquarters locations from analysis
- Used only banks in US states (removed Puerto Rico, American Samoa, Guam, etc..)
- Limited analysis to bank branches at least 2 years of age
- Removed outliers in terms of deposits
Modeling and Predicting Bank Deposits
For each bank being analyzed, we produced:
- A model predicting bank branch performance (measured in deposits) using traditional data only, designed to match industry standard model performance.
- A model predicting bank branch performance using Spatial’s Geosocial segmentation along with traditional bank variables
- Top performing social segments for each bank.
In addition to measuring the top performing social segments for each individual bank, we also measured the top performing segments across each of these major banks.
*See Footer for Data Modeling Notes
Results
The metric we focused on to test our hypothesis was the percentage increase in “error reduction”. Error is defined as the average amount by which a model’s prediction differs from the actual value. Measuring the error reduction is how we can tell how much a set of data improves a model’s success.
The improvement numbers below are the percent increase in error reduction that Geosocial data provides (compared to a baseline model designed to match industry standard model performance). With millions of dollars on the line, each percent improvement that Geosocial data provides can have a huge impact.
The results for each bank are shown in the following table.
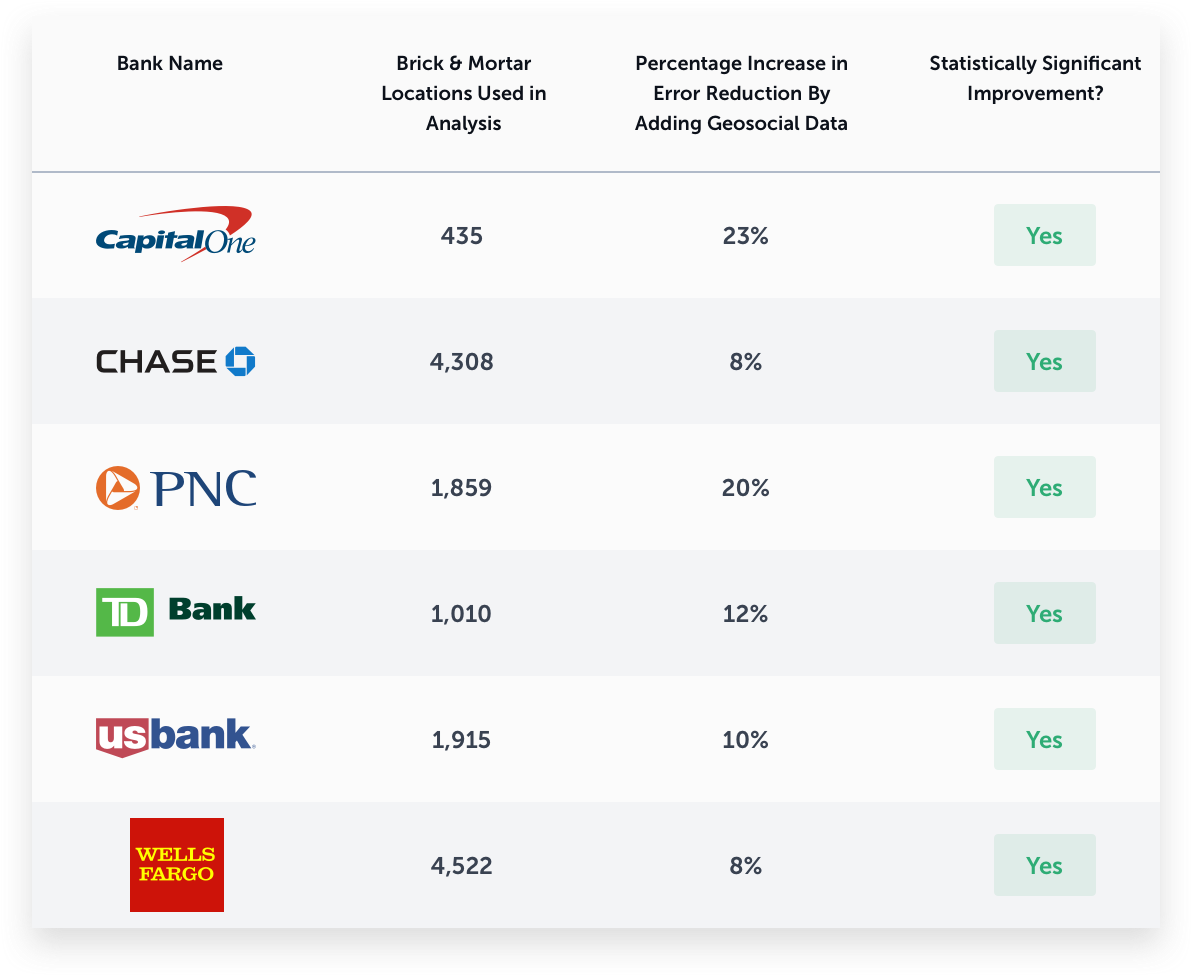
Across the board, we can see that Geosocial data has generated a positive and statistically significant improvement in predicting bank deposits, reducing error by on average 13.5%. This begs a question... if social media data is predictive of bank deposits, what types of behaviors in social media are most indicative of a good bank site? And are these characteristics consistent for all banks? Or do they differ?
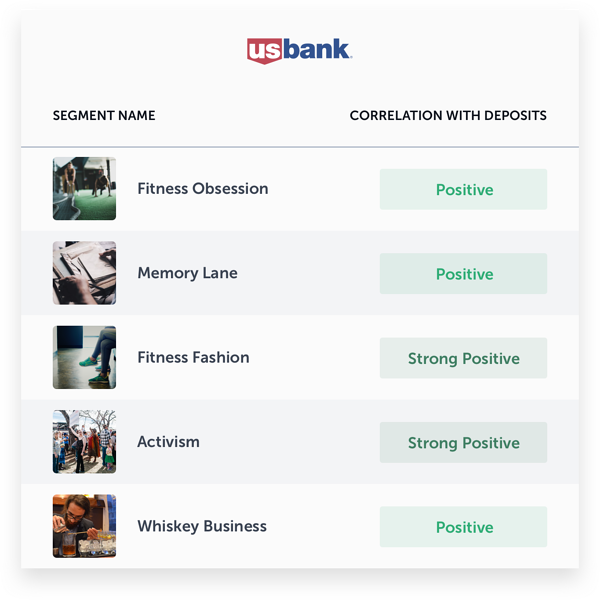
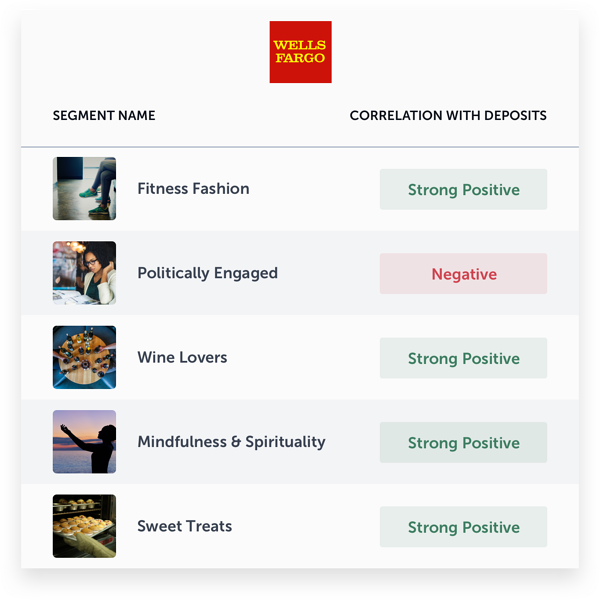
To answer this question, we found for each bank what social media segments were most indicative of a high amount of deposits. The following segments were found to be consistently important in determining if a bank would be successful, or have low deposits.
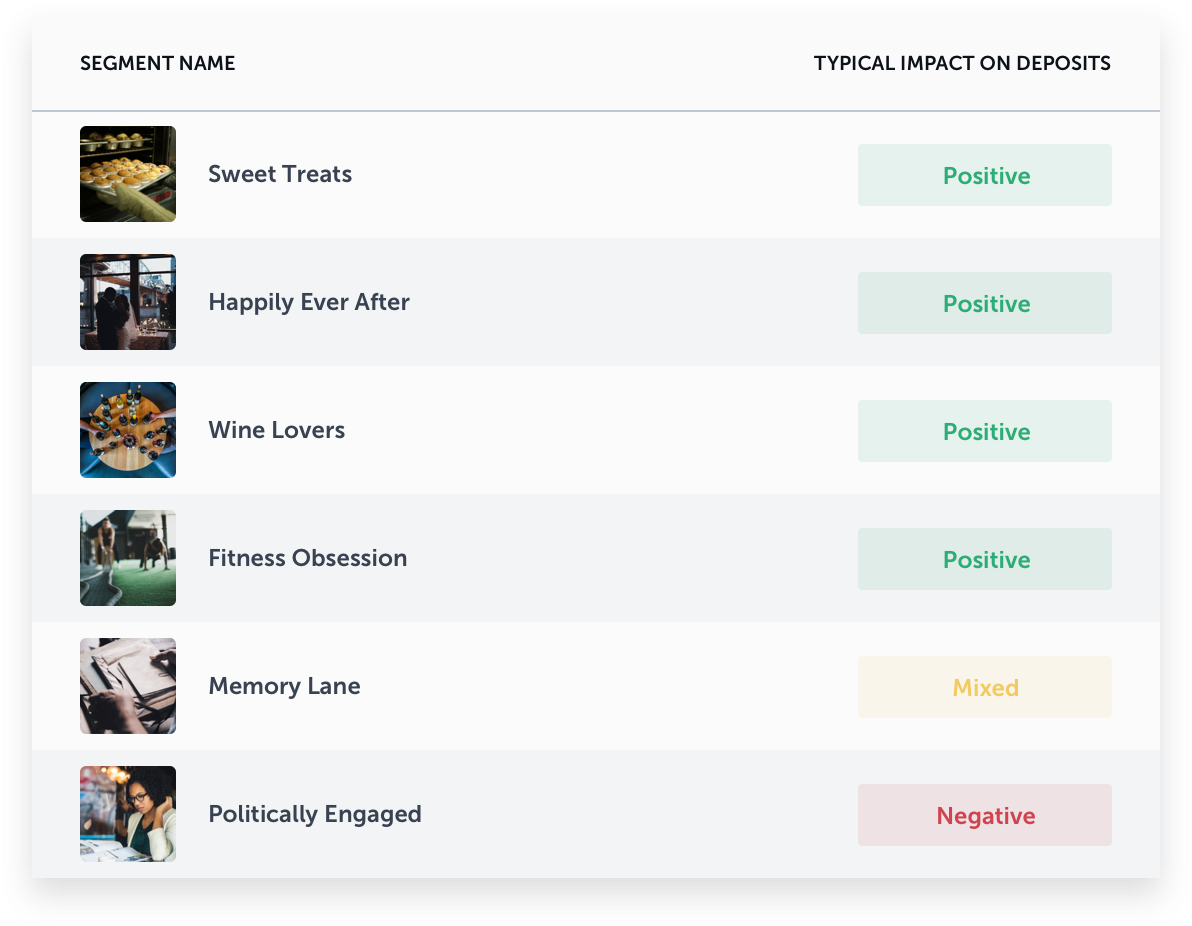
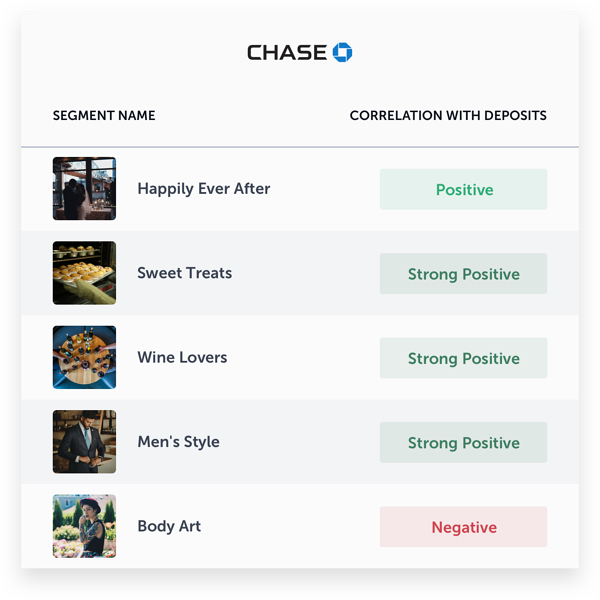
So what does this mean? If we look at the Wine Lovers segment for example, we see that it is high in areas where people often talk about different brands of wine, wine tastings, wineries, and having wine cellars. It is a common behavior observed everywhere, but more commonly associated with high income and well educated neighborhoods. According to the model, it is also a strong indicator that banking performance will be higher in an area. It’s important to note that it is important separately from income and education. Given two areas with similar education and income, we’d expect one interested in wine to drive higher deposits. To dive deeper into the rest of these segments and what they mean, visit http://taxonomy.spatial.ai.
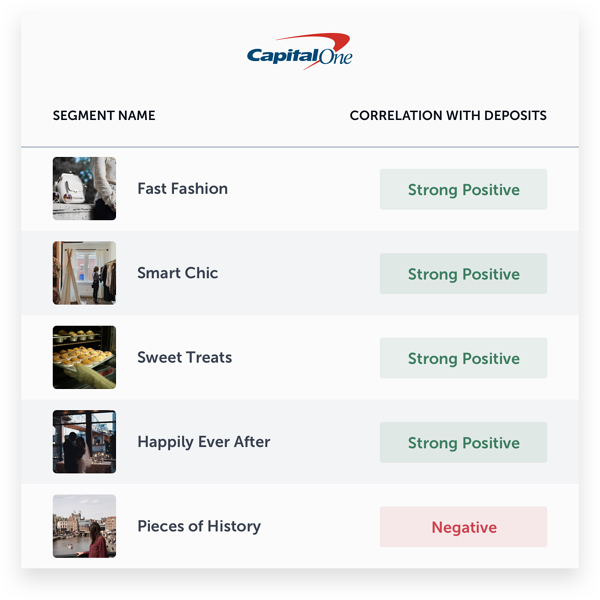
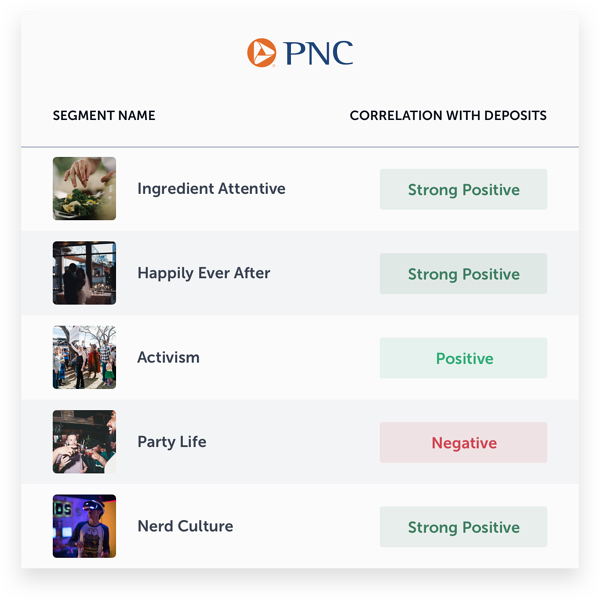
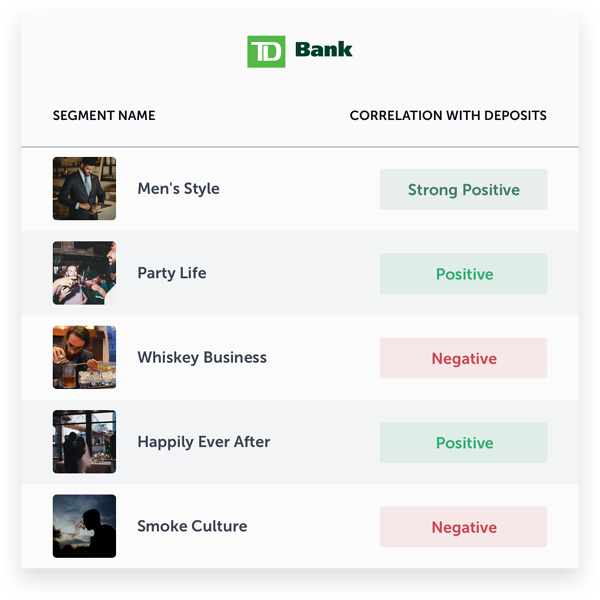
We can get more specific insights by looking at each bank individually. The following tables show important segments for each bank and their impact on deposits.
Putting it in action
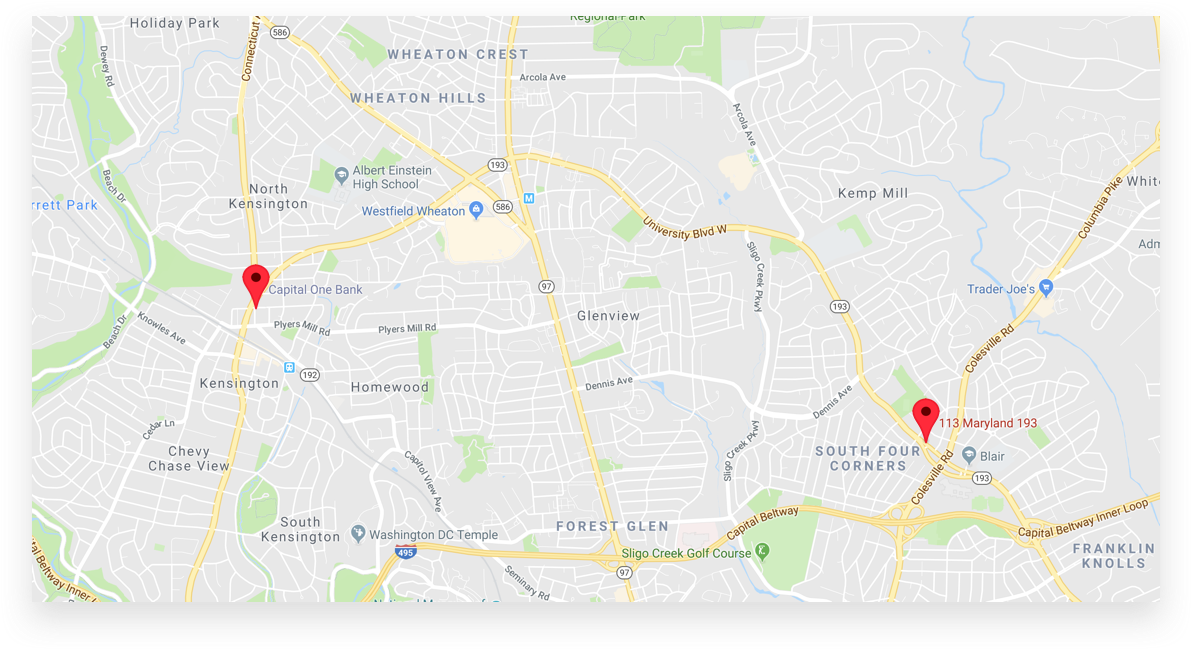
To outline a real example of how this type of analysis can be used by a bank (or any business with brick & mortar locations), we selected two Capital One locations. Both are in areas outside of Washington, D.C. The first one is in Silver Spring, Maryland. The second is in nearby Kensington, MD. These two branches are less than 5 miles from each other.
First, we look at the data included in a traditional demographic based site selection model. We found that the demographics within a 1.5 mile trade area were, unsurprisingly, very similar. This table has a small sample of some of the key demographic variables used in traditional models, and how a typical site selection approach would evaluate these two markets.
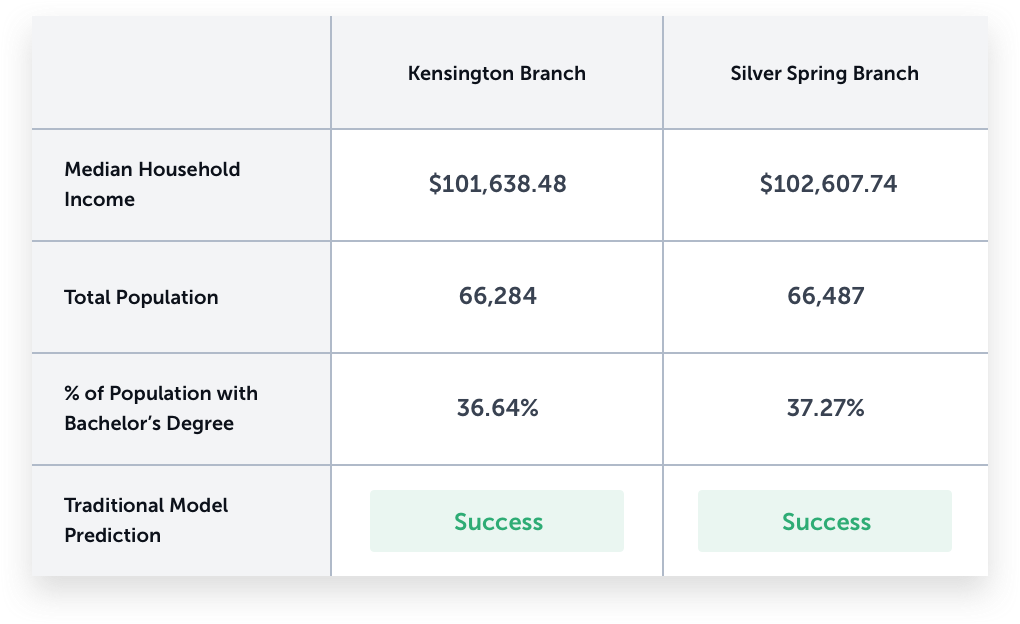
According to demographics, these two branches should perform similarly and both locations would be approved during the site selection process.
So how do these two banks actually perform?
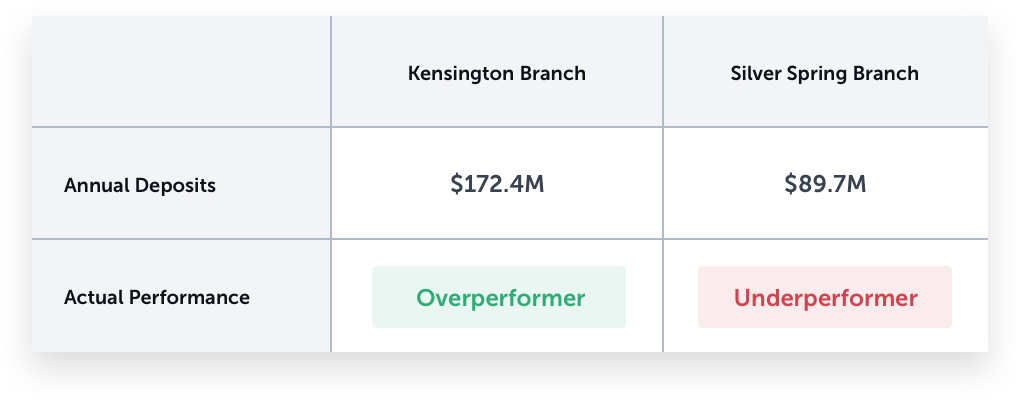
The Kensington Branch received nearly double the level of deposits as the Silver Spring branch, despite nearly identical demographics in the area. Clearly, something is missing from the traditional demographic analysis.
Let’s look at Geosocial data. We analyzed in the same trade areas, social segments that were identified to be key indicators for Capital One and banks in general to see how these two areas might be different.
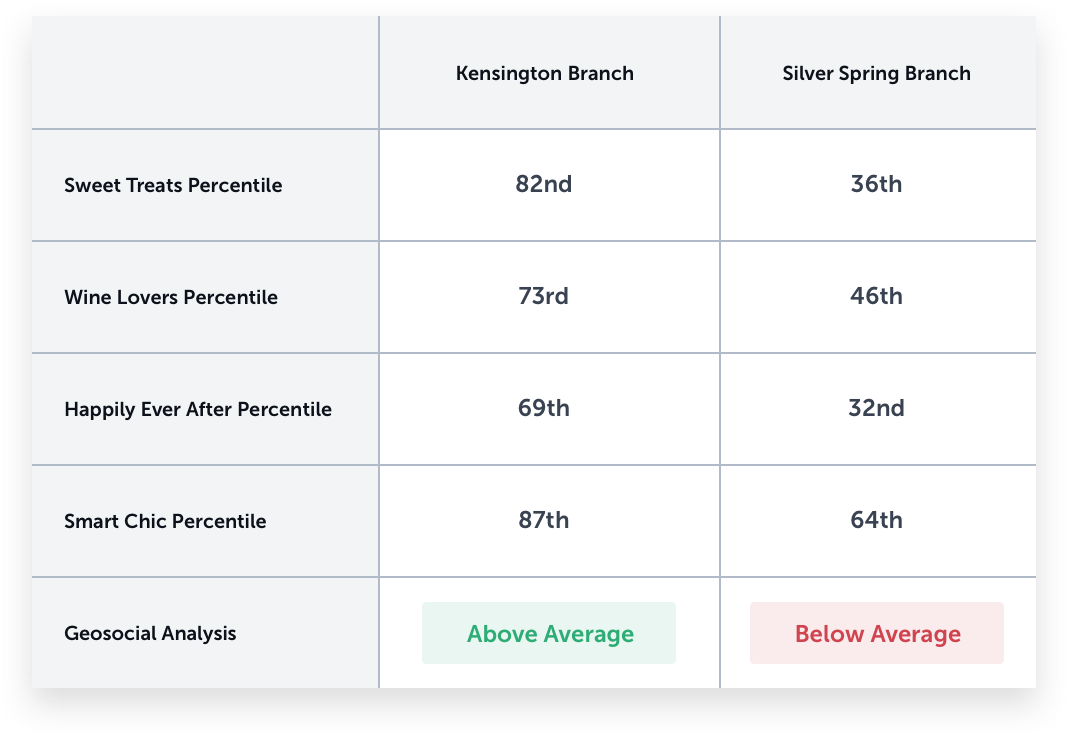
Not only could Geosocial data explain how these two areas were different, it also showed that the area had far higher levels of key behaviors in the community proven to indicate banking success. This is a radically different story than the demographic information, and is reflected in the performance levels of these two branches.
This is just one example. More importantly, we found that overall for all Capital One locations, Geosocial data provided a 23% improvement to traditional models.
Conclusion
Using publicly available data our tests proved that Geosocial data could significantly improve the site selection process for banks, reducing the likelihood of opening branches in underperforming communities. We learned that behaviors like community interest in wine, sweets, and fitness consistently have a positive impact on bank performance. These insights can not only help banks locate new branches closer to customers, but also help them better understand the humans and personalities behind their performance.
This data is available and being used to make thousands of real estate decisions. To incorporate this type of information into your location strategy or learn more about its relevance for your business, access a free sample dataset and data guide.
* Data Modeling Footer Notes
Models experimented with and used include Linear Regression, Random Forests, and Gradient Boosting Regression. Great care was taken to avoid overfitting. Methods used to prevent overfitting included k-folds cross-validation (in a train, validate, and test setup) and numbers reported in this report were measured on holdout data. Methods to interpret models include partial dependence plotting (PDP), feature importance, correlations, and more.
What you should do now
Whenever you're ready, here are 3 ways Spatial.ai can help:
- See PersonaLive In Action. If you'd like to segment and target your best customers using real-time behavioral data, schedule a free 30-min demo to get started.
- Subscribe To Consumer Code. If you've found this helpful, check out our newsletter and podcast where we share more consumer research and insights for retail marketers.
- Share This Post. If you know another marketer who’d enjoy reading this post, share it with them on Linkedin, X, or Facebook.
Get retail marketing tips
We email every monday with smart growth strategy ideas. Almost no promotion. Just value.

.avif)
%20(1).jpg)