How to Predict Retail Sales Using Social Data

“Will my business do well here?”
Every location decision is centered around answering this simple question. But before you can answer that question, you need to answer two others first:
- Who are my customers?
- Where do they spend their money?
If you can understand your customer’s demographics and psychographics, as well as their social and spending behavior, you are much more likely to make more accurate decisions and build more predictive models.
To aid you in answering those questions, we’ve compared sales data from Devonshire with Geosocial data to analyze the relationship between retail sales and consumer behavior in a given area.
So what does that look like?
Below are two simple case studies to illustrate how you can predict retail sales using social data. For technical details and methodology, scroll to the end.
Leasing Strategy
Let’s say the landlord at 3400 16th Ave W, Seattle has a vacancy. What businesses should they target to fill the vacancy for long term success?
Step 1: Identify the Top Segments in the Area
First, let's take a look at the top interests of the surrounding area. Below are the top 3 Geosocial segments.
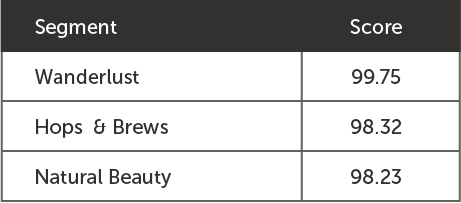
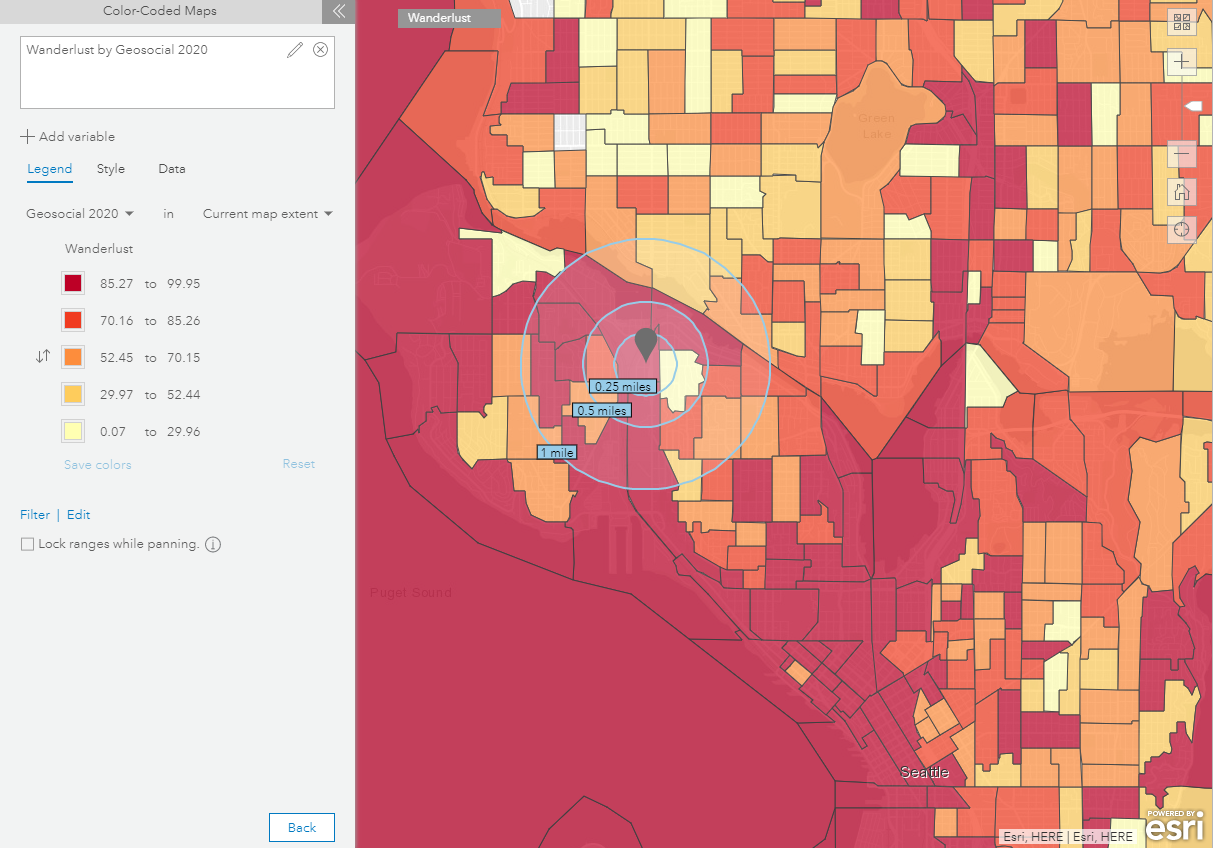
When we map Wanderlust around the site, we see that both the immediate block group and the surrounding area score highly for this segment.
Step 2: Identify the Top Retail Types for the Top Segment(s)
Next, we need to find out what type of store sales over-index in areas where Wanderlust scores highly.
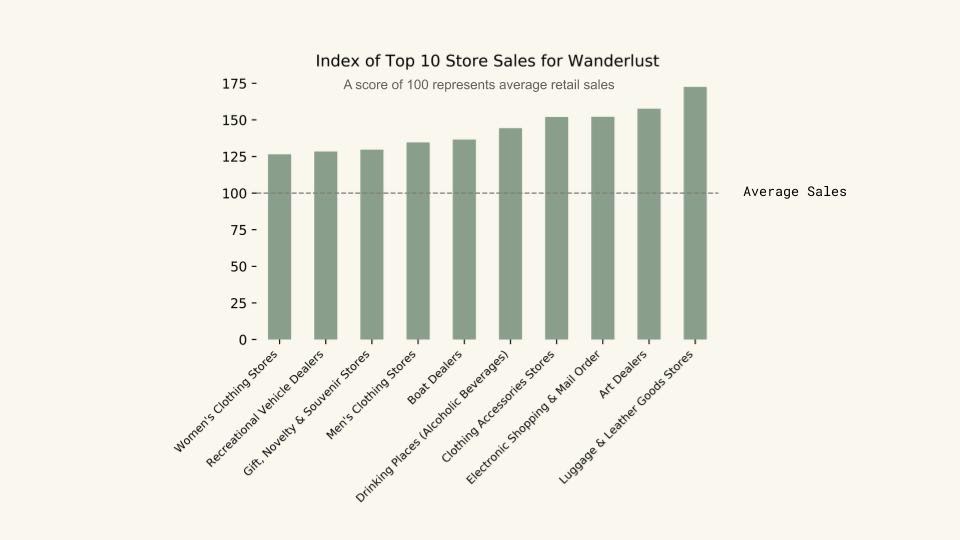
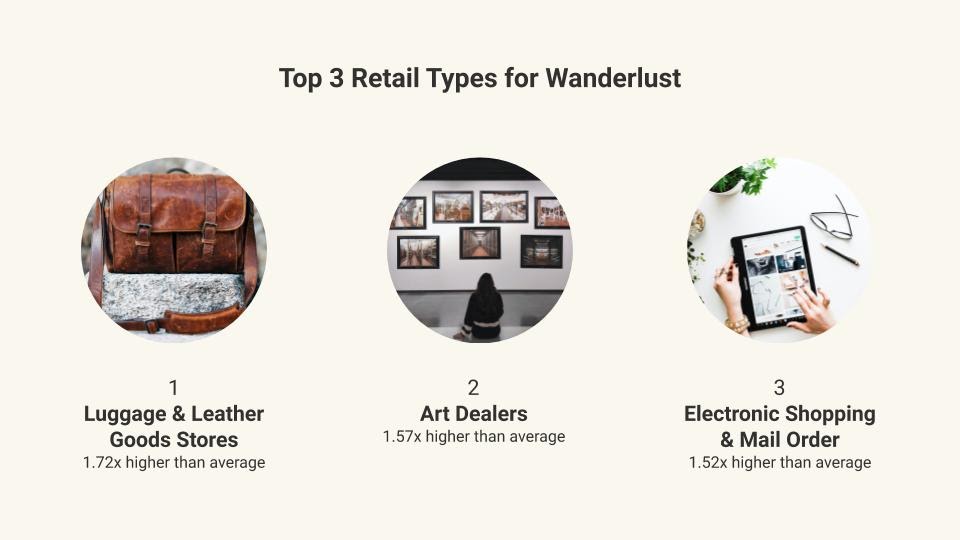
On average, the top three retail types for areas scoring highly for Wanderlust are:
- Luggage & Leather Goods Stores (1.72x higher sales than average)
- Art Dealers (1.57x higher sales than average)
- Electronic Shopping & Mail Order (1.52x higher sales than average)
Therefore, any of these businesses could be a good fit for this vacancy.
Site Selection
Let’s say CulinArt Group is looking to open a new site in Washington DC. Where should they locate in this market?
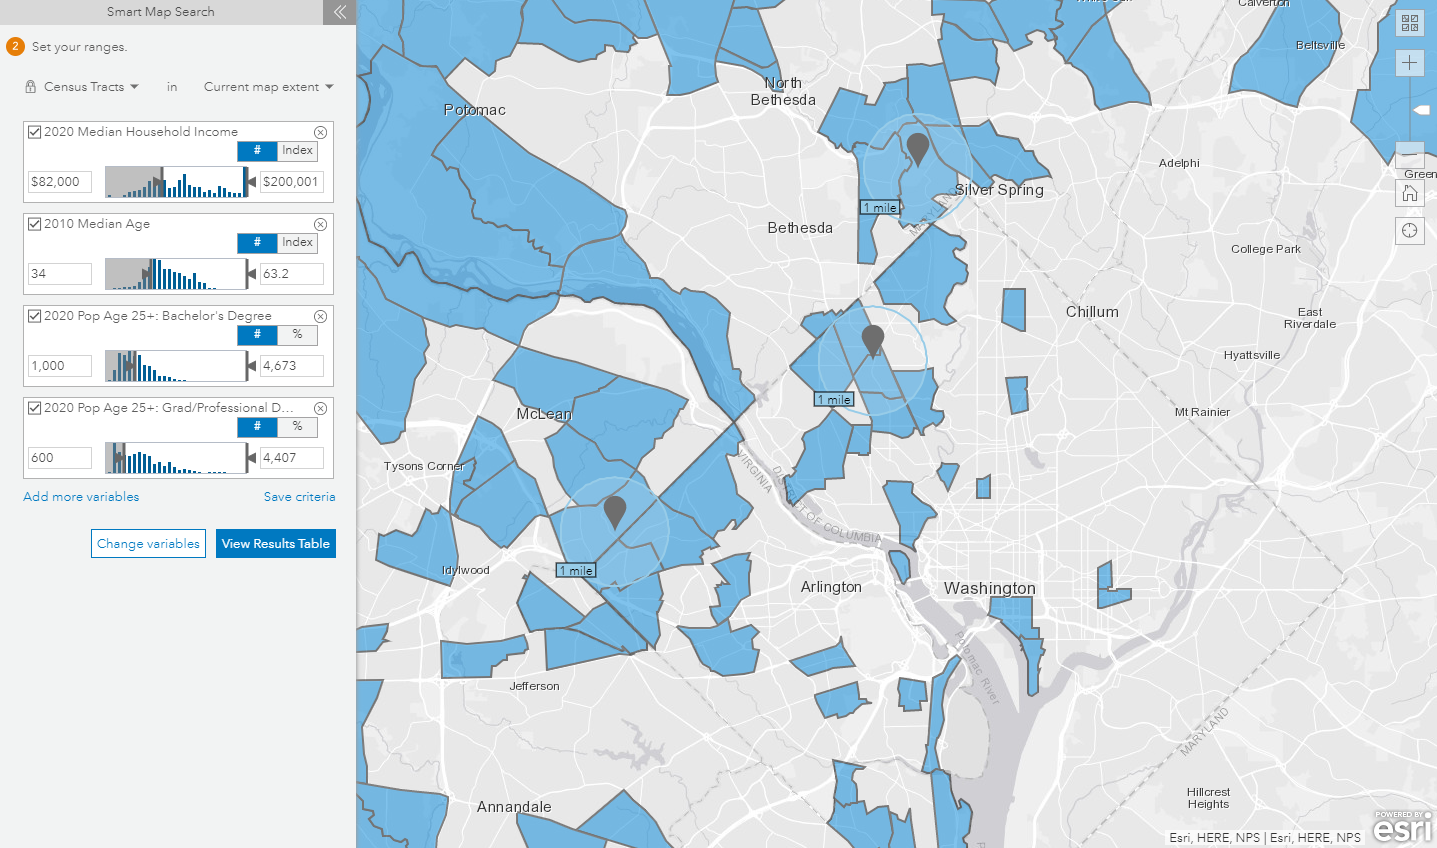
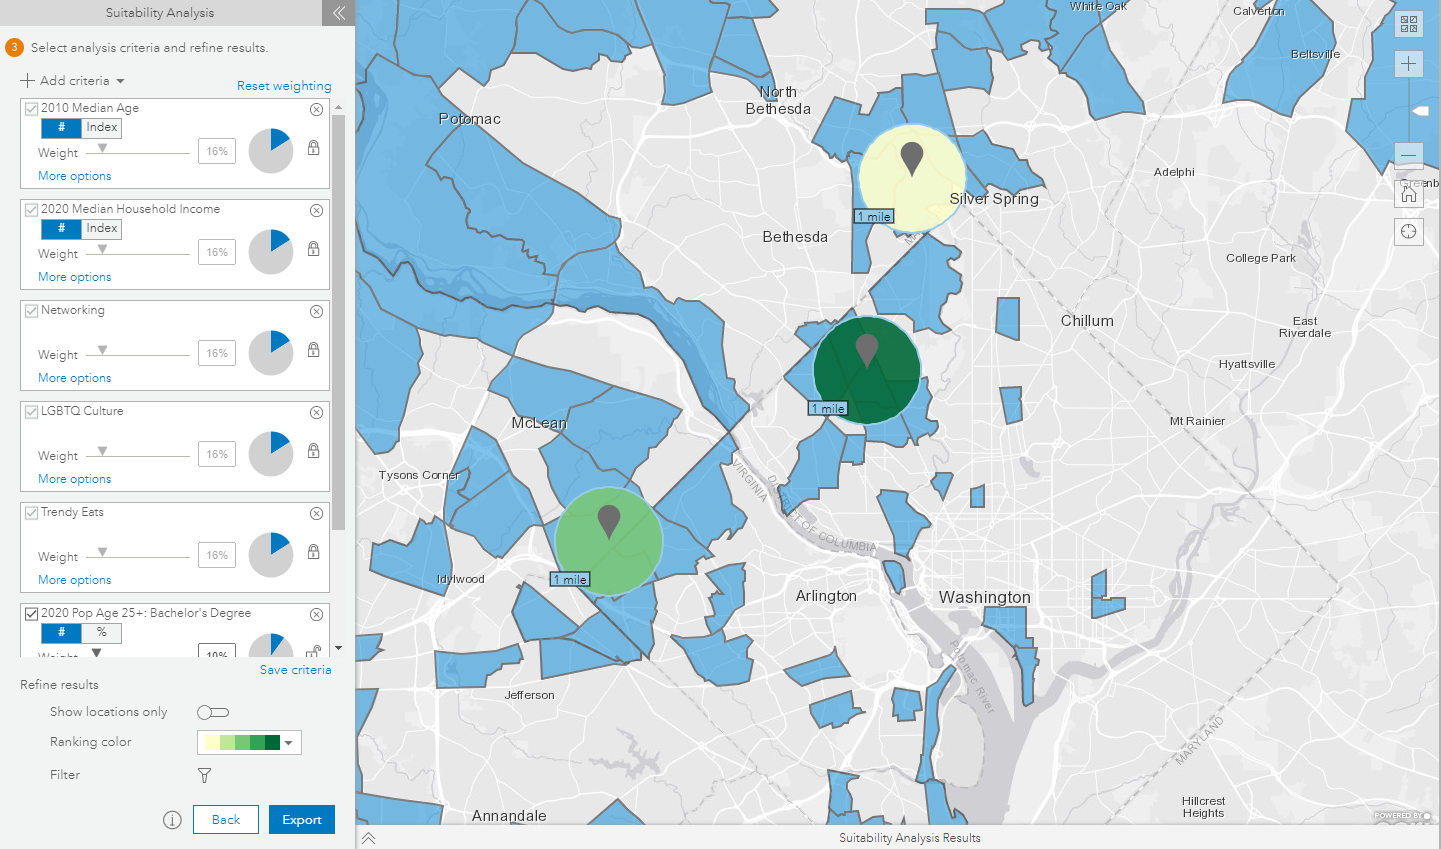
Step 1: Demographic Suitability Analysis
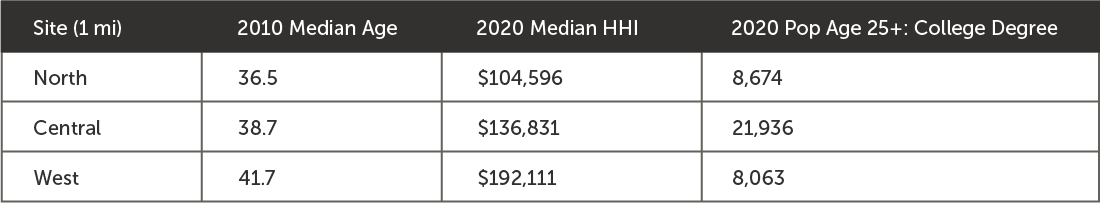
First, we want to make sure we are meeting our basic demographic criteria. The following areas of Washington DC have the best fit for age, income, and education.
Step 2: Identify Top Segments for the Industry
Ok, we’ve met our demographic criteria. But which of these areas has people with interests and behaviors that align with the CulinArt brand? To answer that, we can look at the top over-indexing segments for Special Food Services sales.
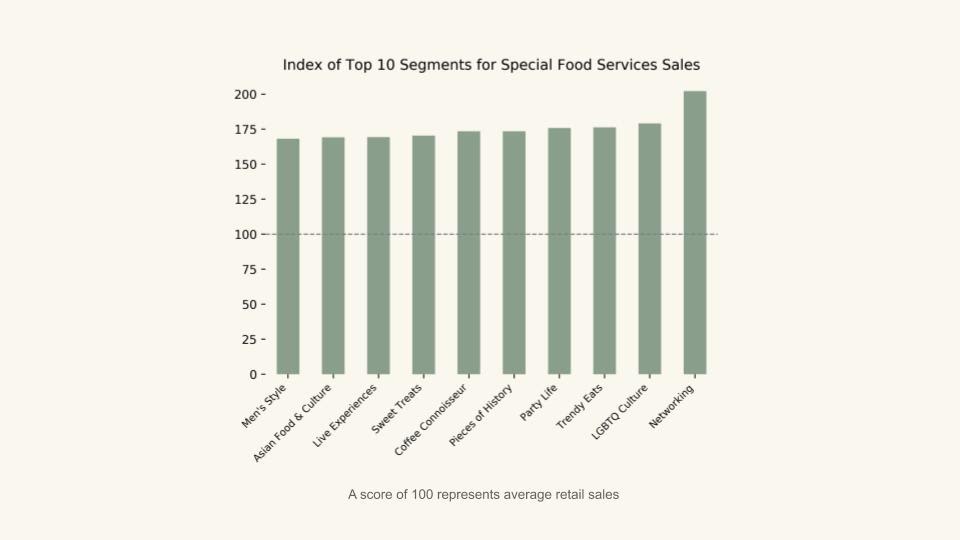
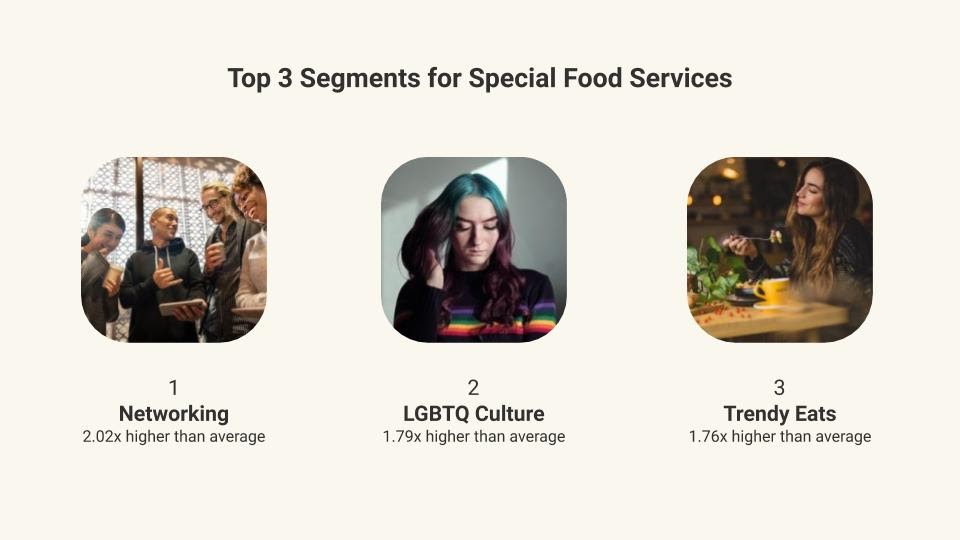
On average, the top three segments associated with high Special Food Services sales are:
- Networking (2.02x higher scores than average)
- LGBTQ Culture (1.79x higher scores than average)
- Trendy Eats (1.76x higher scores than average)
When we layer in the top segments for Special Food Services sales, we see that the Central location is a clear winner and best overall fit for CulinArt Group
Conclusion
Knowing who your core customers are and where they spend money is crucial to making better location decisions. These sales relationships are now available in all customers’ Spatial.ai Cloud accounts. If you’d like to learn more about Geosocial data and how to leverage it for your use case simply contact us.
Appendix: Technical Details
Data Sources
Spatial.ai’s data contains a score for each of 72 social segments- everything from Dog Lovers to Yoga Advocates, all described in our taxonomy. Devonshire’s data contains retail sales for each of 69 store types across retail and food services NAICS codes. NAICS, or the North American Industry Classification System, is how the Bureau of Labor Statistics reports industry for tax returns.
Method
The retail sales data in each industry tended to follow a lognormal distribution, so a natural log transformation was applied to retail sales to better capture the relationship between social segment scores and retail sales.
To make sure we’re capturing the best signal of the true relationship between social segment scores and retail sales, only block groups with a Volume Index of greater than 1.0 were considered. This means that block groups with higher than median amounts of social media- in the top 50%- were used for analysis.
Ranking Top Retail Types & Customer Segments
To easily view the industries and segments with the strongest relationships, an index was created to relate retail sales and top scoring block groups. Top scoring block groups are defined as those with a score of greater than 75, which means they are in the top 25% of the country for the given segment. The average sales per industry and segment were compared between top scoring block groups, and all block groups. The index represents this difference.
100 is the baseline, indicating that the average industry sales in top scoring block groups is the same as the average industry sales in all block groups. Values above or below 100 indicate that the average industry sales in top scoring block groups is higher or lower respectively than the average industry sales in all block groups. For example, the segment All About Hair and Cosmetics, Beauty Supplies & Perfume Stores have an index of 347, which indicates that Cosmetics, Beauty Supplies & Perfume Stores sales are on average 3.47x higher in areas that score highly in All About Hair compared to all areas.
In addition to evaluating an individual index, it is also helpful to rank indexes to find the top industries for a segment, or vice versa. Sorting by the segment Engine Enthusiasts high to low by index, the top 5 industries can be seen below. These industries have higher sales on average in areas with high scores for Engine Enthusiasts.
Quantifying Retail-Segment Correlation
To understand the relationship strength and direction, we also calculated correlation between each pair of social segments and industries. Pearson correlation is a common statistic that measures linear correlation between two variables, in this case scores between one social segment and retail sales in one industry. Pearson correlation has a value between +1 and −1.
High values of correlation indicate a strong positive linear relationship, where as social segment score increases, retail sales increase. For example, the segment All About Hair and Health & Personal Care Stores have a correlation of 0.29, which indicates that there is a strong positive linear relationship between a location’s segment score for All About Hair and Health & Personal Care Store sales in the area.
Low values indicate a strong negative linear relationship, where, as social segment score increases, retail sales decrease, and scores close to zero indicate a weak or nonexistent relationship between segment score and retail sales.
In addition to evaluating an individual correlation, it is also helpful to rank correlations to find the industries with the strongest relationship to a segment, or vice versa. Sorting by the segment Engine Enthusiasts high to low, the top 5 industries with the strongest positive correlation can be seen below. These industries likely have higher sales in areas with higher scores for Engine Enthusiasts.
What you should do now
Whenever you're ready, here are 3 ways Spatial.ai can help:
- See PersonaLive In Action. If you'd like to segment and target your best customers using real-time behavioral data, schedule a free 30-min demo to get started.
- Subscribe To Consumer Code. If you've found this helpful, check out our newsletter and podcast where we share more consumer research and insights for retail marketers.
- Share This Post. If you know another marketer who’d enjoy reading this post, share it with them on Linkedin, X, or Facebook.
Get retail marketing tips
We email every monday with smart growth strategy ideas. Almost no promotion. Just value.
.avif)
%20(1).jpg)