Predicting CPG Sales: A Comparison of Demographics vs Traditional Segmentation vs PersonaLive


“How can I best predict my retail sales?”
With so many options to predict sales outcomes, is demographics, psychographic segmentations, or something else the most powerful choice? In this case study, we’ll explore the options, and find how best to predict retail sales.
Input Data
In this study, we’ll compare 3 different datasets’ performance in predicting sales data:
- Basic demographics variables age and income
- A leading psychographic segmentation
- PersonaLive™, the new segmentation by Spatial.ai
The new PersonaLive™ segmentation system organizes households into one of 80 behavioral segments based on social, mobile, web, and individual demographic characteristics.
Hypothesis
Psychographic segmentation systems categorize people based on demographic traits alone, whereas PersonaLive™ was created using not only demographics but also cell phone movement data, social media, and website visitation. We hypothesize that this added behavioral data improves the segmentation’s ability to predict sales outcomes.
Test Dataset
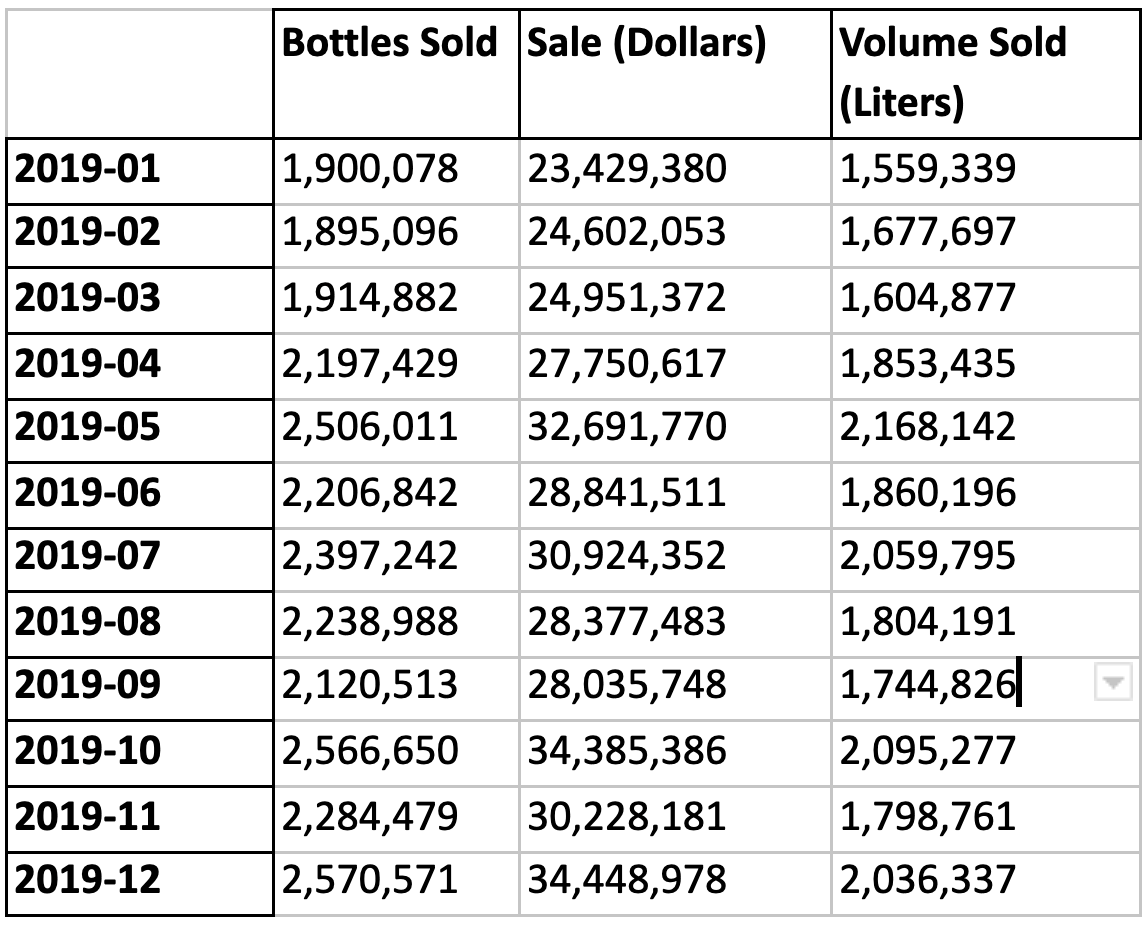
We will be modeling Iowa liquor sales as our outcome variable. In this dataset, sales are given as dollars per transaction. Monthly sales are 2.2 million bottles, $29 million, and 1.8 million liters on average, and there are 1,741 stores included in the final analysis.
Scope
In preparation for modeling, we filtered the data to focus on 10 high volume products that vary in who consumes them: Black Velvet, Captain Morgan Original Spiced, Crown Royal Regal Apple, Grey Goose, Hawkeye Vodka, Jose Cuervo Lime Margarita, Malibu Coconut Rum, Smirnoff 80 proof, and Tito’s Vodka. Additionally, high volume orders were removed to avoid bulk orders from businesses and focus on consumers.
Methodology
In this analysis, the state of Iowa was split into hexagonal grid cells using H3. Sales of each product were combined within each cell. By aggregating sales this way, we can model for what factors lead to sales in a given area rather than in specific locations, which may have many other variables to consider.
For each chosen product, we built 3 linear models: one for each input dataset. Sales are scaled by number of stores (to capture average performance per store) and population. Ultimately, we are evaluating each dataset's ability to predict how well this liquor product does in a given location. Further, these transformations give us an index for how well a product suits the population of an area.
Each dataset's performance will be reported as a percentage improvement on simply predicting the mean value. You can think of this performance metric as answering the question: how much did we reduce mean absolute error from baseline using predictions from this model?
1: Basic demographics model
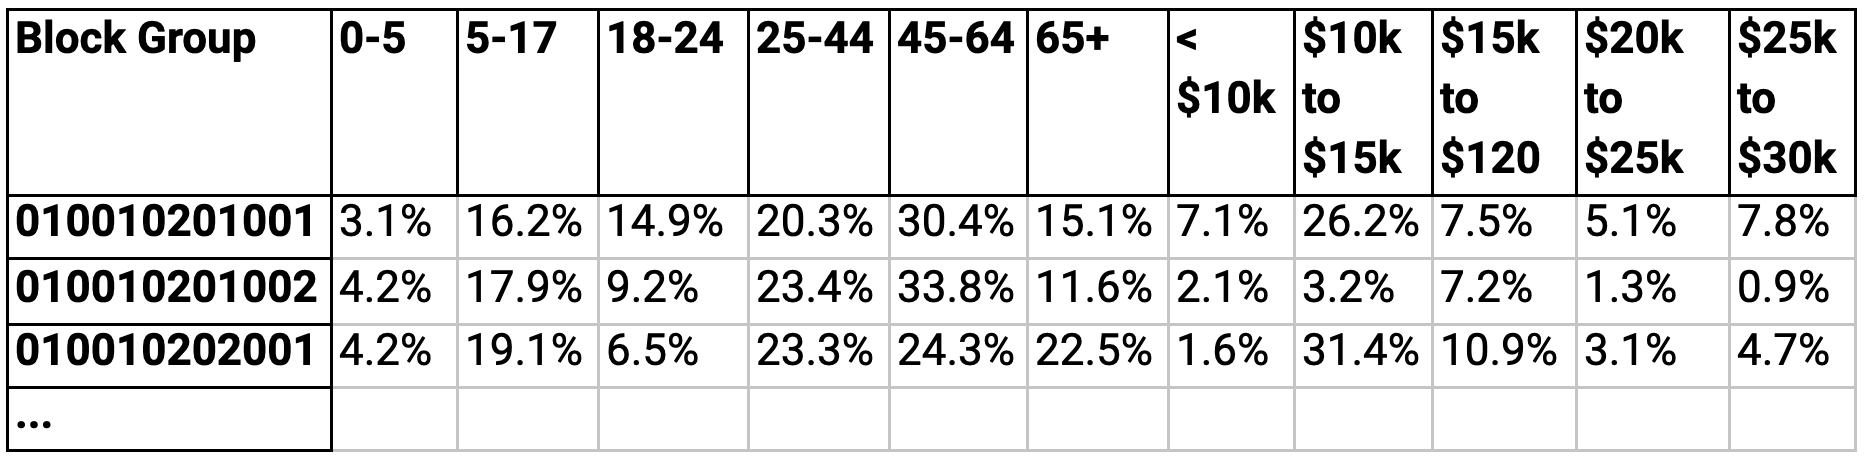
Our first model uses basic demographics: age and income. This data is available from the US Census, and is our baseline in predicting sales outcomes. The variables we are using are the population percentage per block group for each age range and income range.
Running the linear regression, we find that on average across all 10 brands, demographics reduce error by 8.3%, compared to guessing mean sales per person per store for each brand.

2: Leading psychographic segmentation model
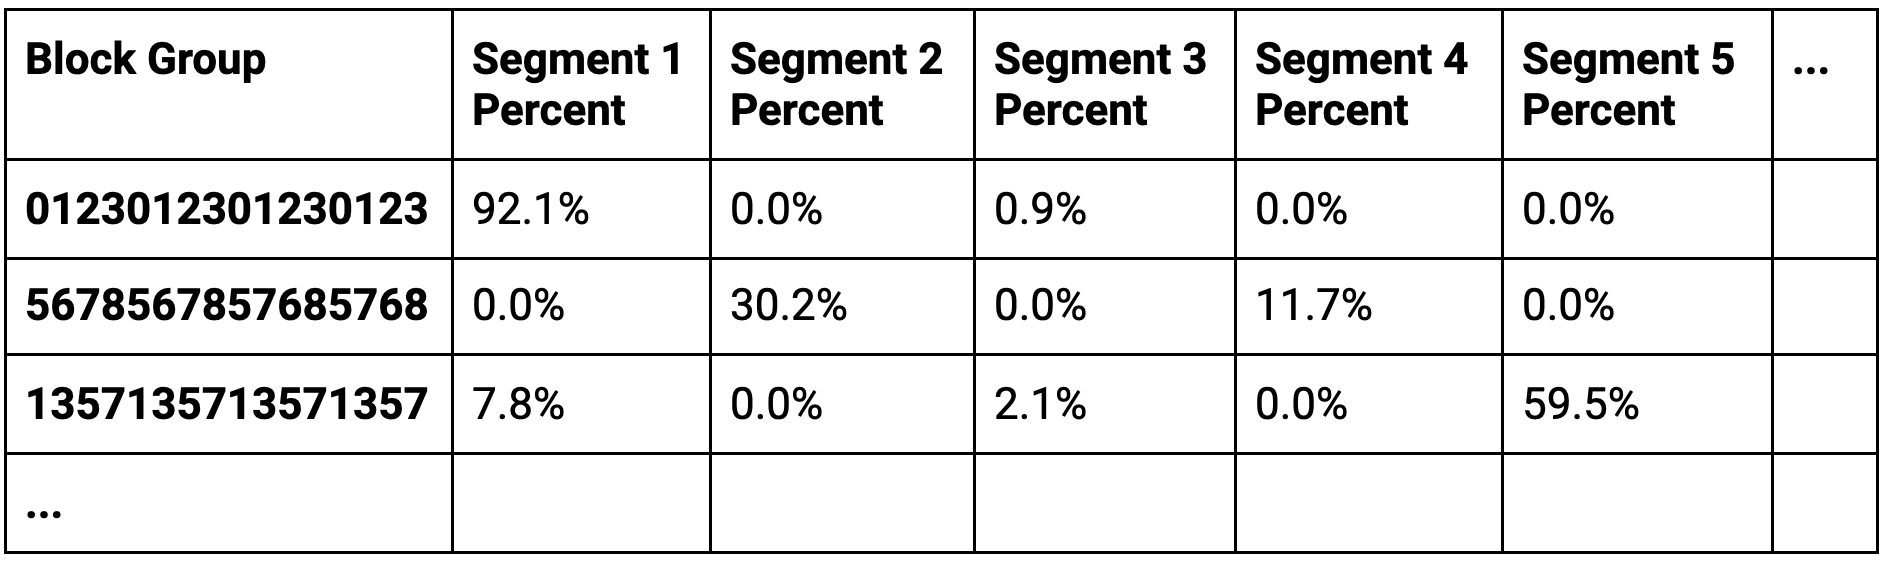
Our second model uses a leading psychographic segmentation (also referred to as geodemographic). This type of dataset is frequently used in predicting sales outcomes. The variables we are using are the percentage of households per block group in each segment.
On average across all 10 brands, this leading psychographic segmentation reduces error by 21.8%, compared to predicting the mean value for each brand. This is a 13.5% improvement compared to demographics alone. This is good, but can we do better?

3: PersonaLive™ model
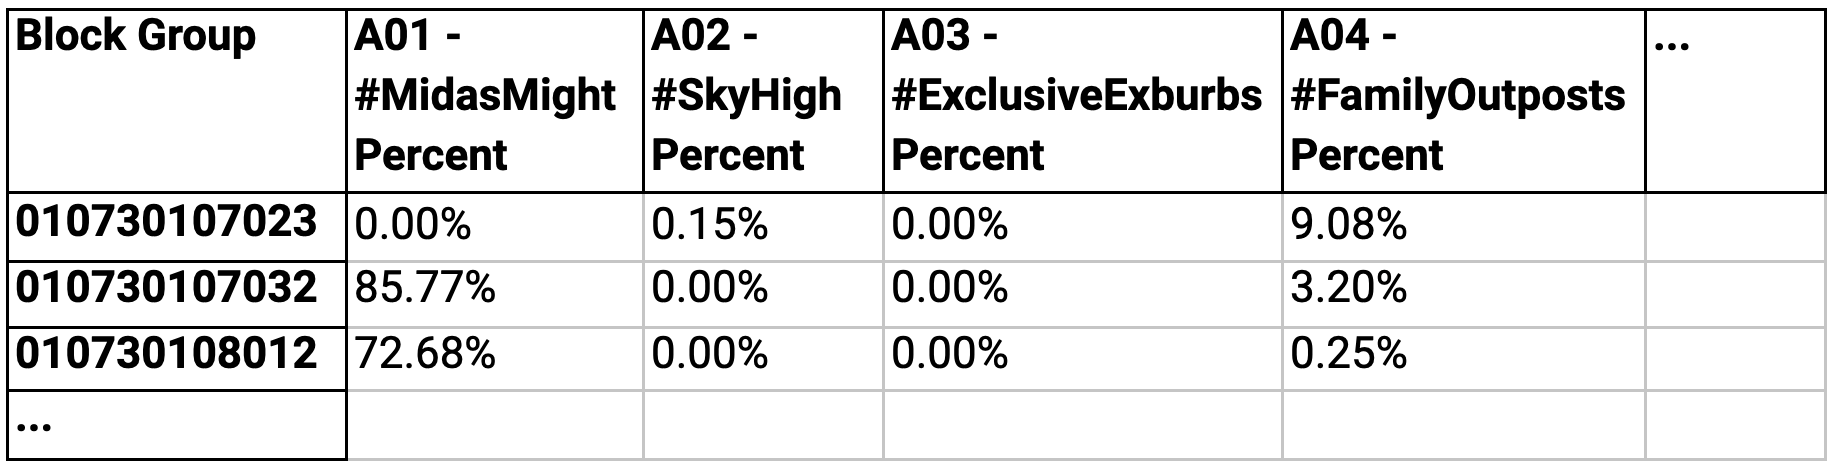
Our third model uses the PersonaLive™ segmentation. PersonaLive™ is a new segmentation by Spatial.ai that uses social, mobile, web, and individual demographic characteristics to organize households into one of 80 behavioral segments. The variables we are using are the percentage of households per block group in each PersonaLive™ segment.
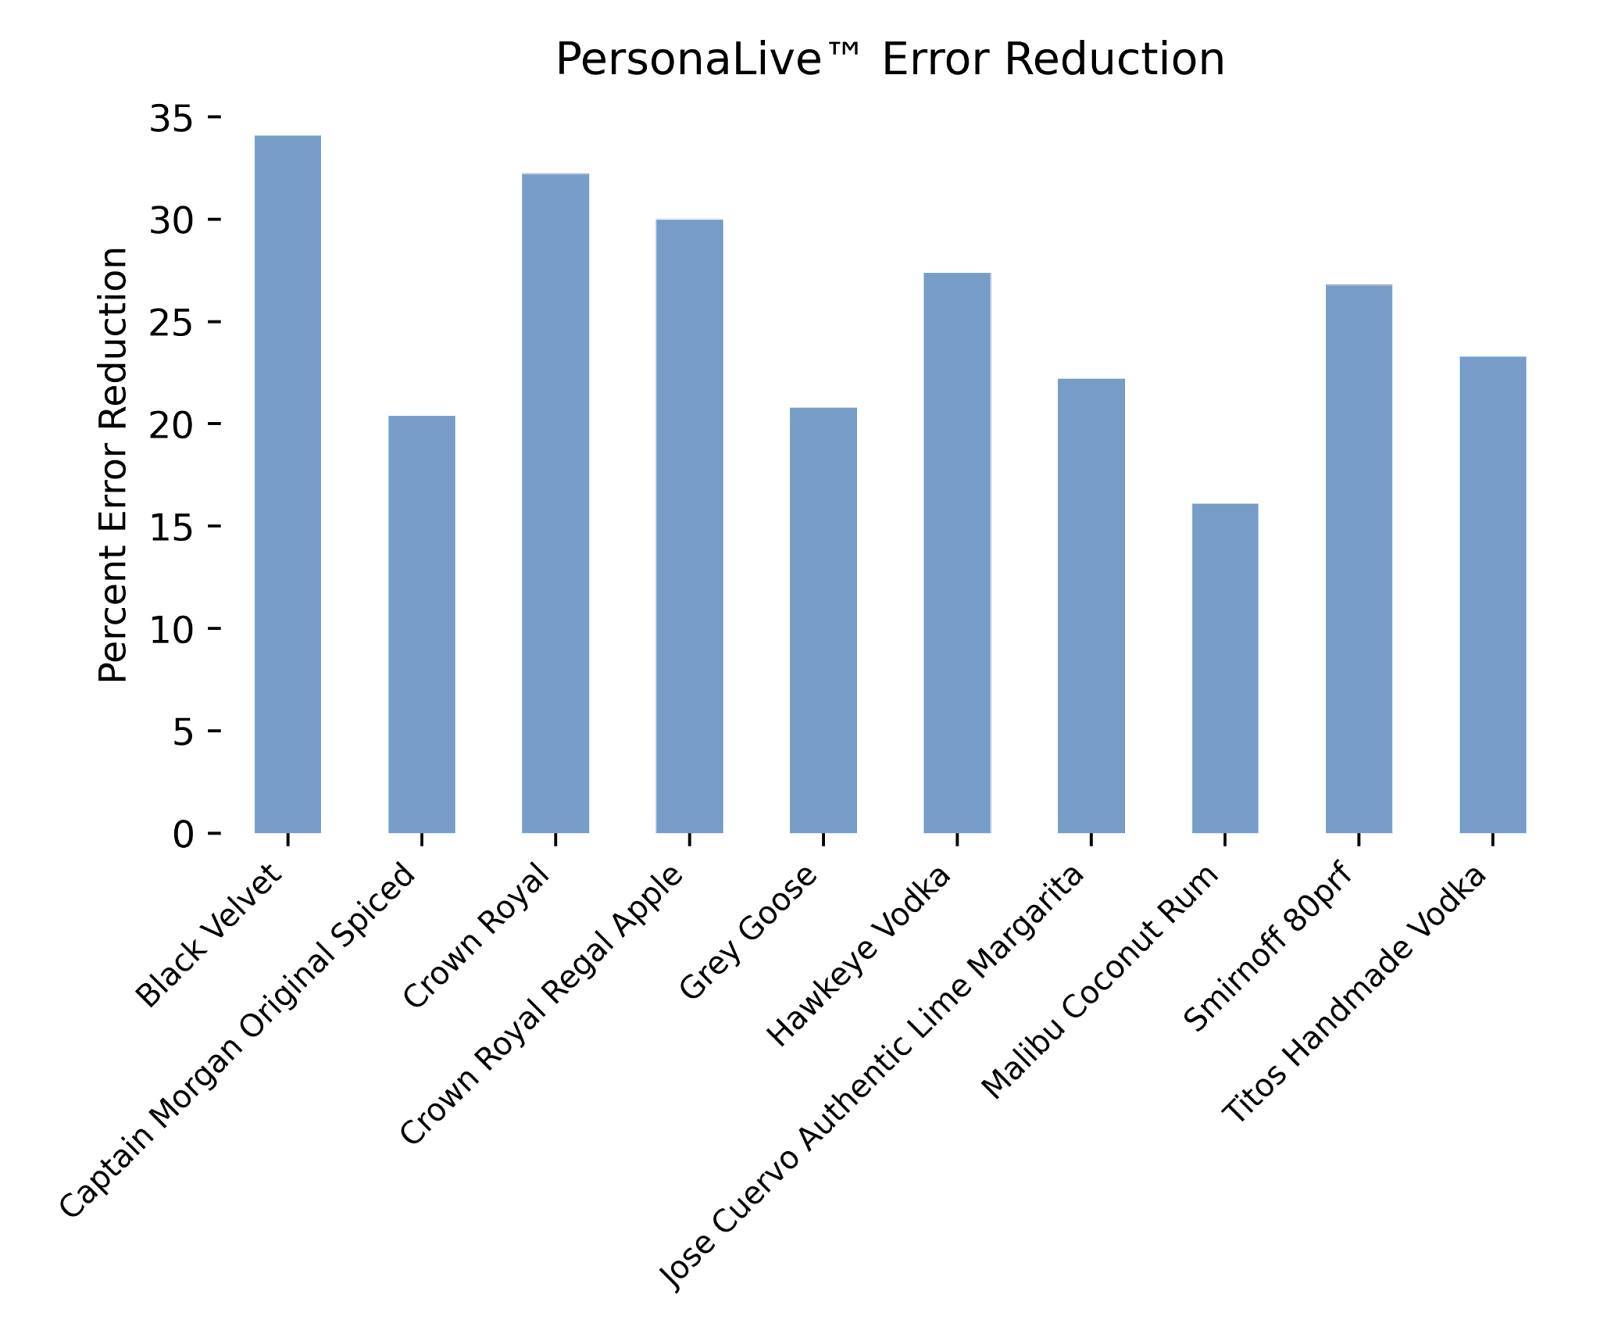
Across all 10 brands, the PersonaLive™ segmentation reduces error by 25.3%, compared to guessing mean sales per person per store for each brand. This is a 17.0% improvement compared to demographics alone, and a 3.5% improvement compared to the leading psychographic segmentation that was used in this analysis.
Results
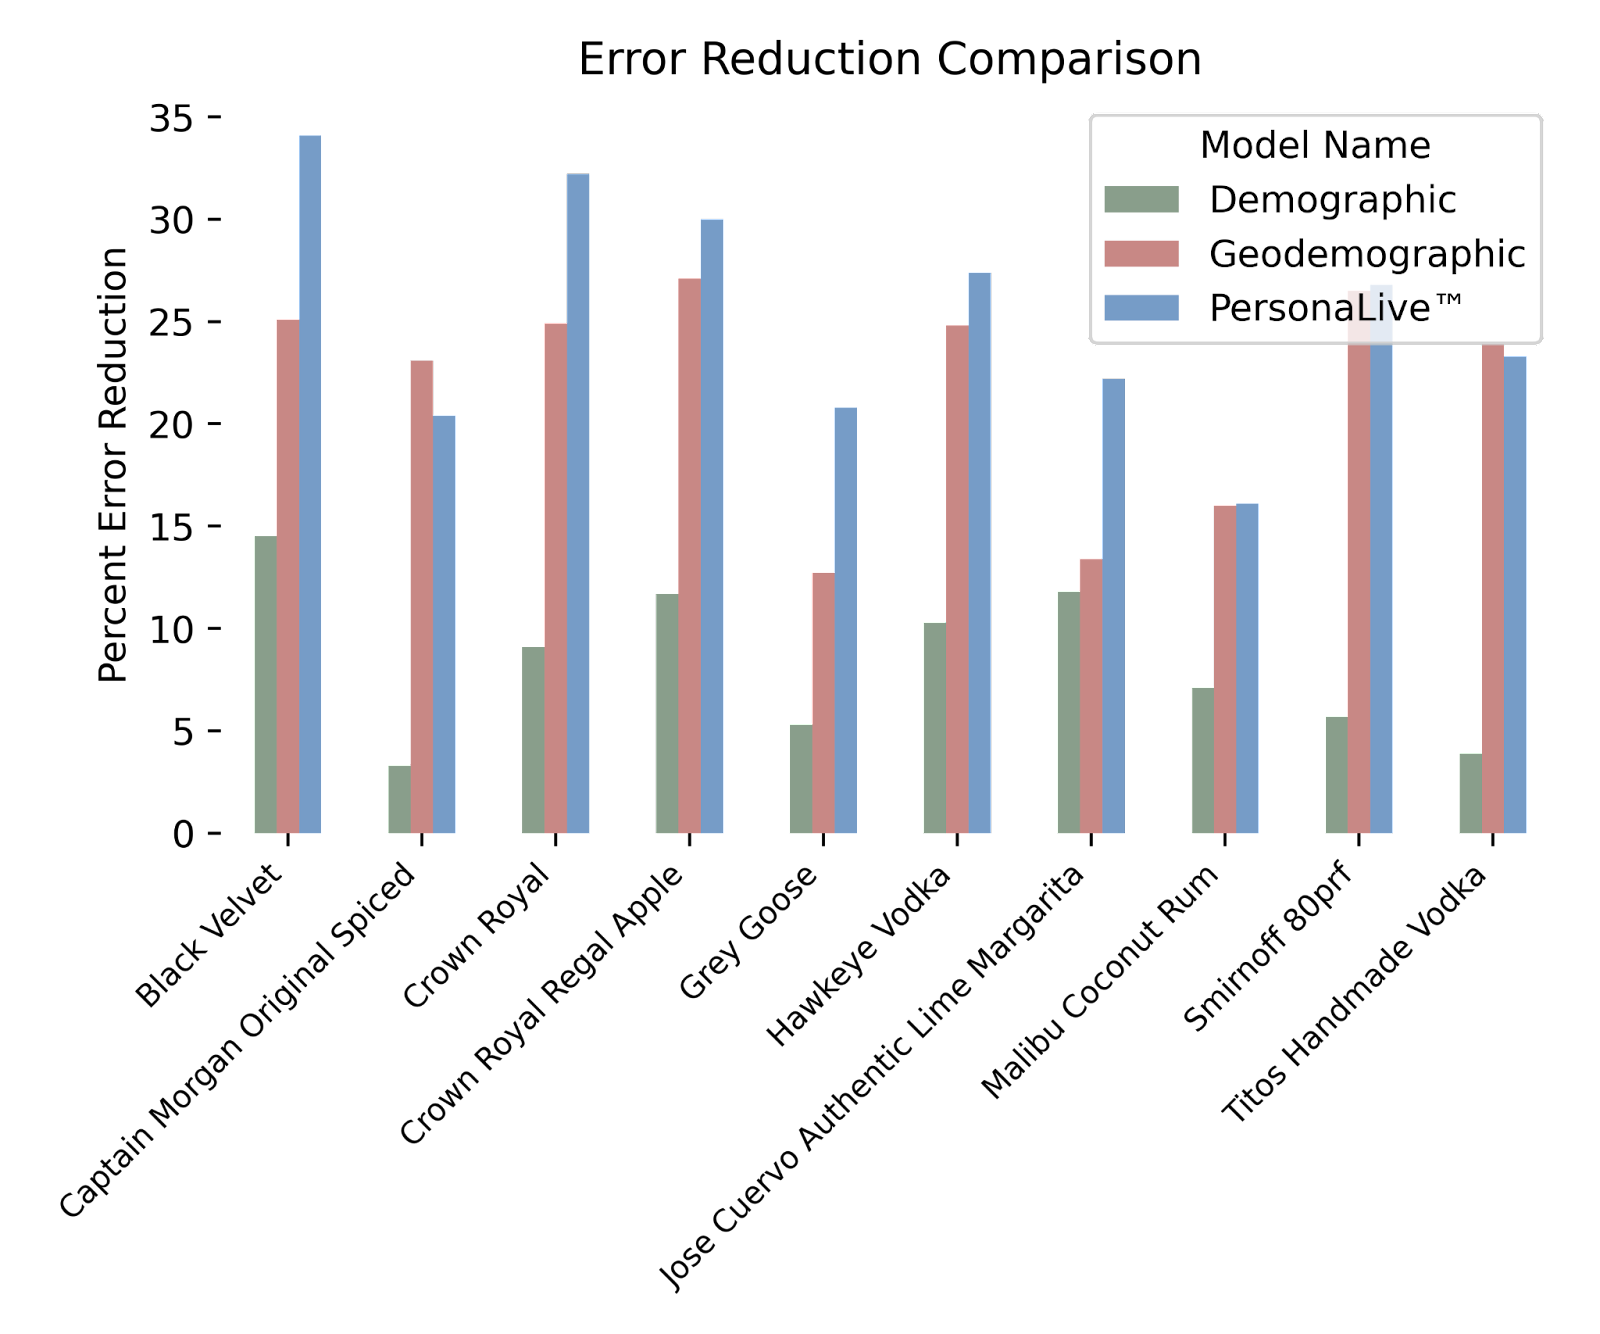
This table shows PersonaLive™outperforming both basic demographics and a leading psychographic segmentation in predicting sales for the liquors in this analysis. These liquors were chosen to represent a breadth of products without any prior knowledge of dataset performance in predicting their sales. Compared to demographics and a leading psychographic segmentation, PersonaLive™ has the highest reduction in error for 8 of 10 brands.
Application
Using PersonaLive™ data and this type of modeling, each of these brands can not only identify locations where their products will succeed but also understand the behaviors that are associated with people who buy their product. This type of analysis has implications that stretch into industries well beyond CPG liquor sales.
Conclusion
In this case study, we investigated three datasets: age and income demographics, a leading psychographic segmentation, and Spatial.ai’s new PersonaLive™ segmentation. Amongst these datasets PersonaLive™ had an edge in predicting liquor sales.
While this post described just one sales dataset, we used a large variety of outcome data from various industries to optimize the performance of PersonaLive™. In the majority of tests, PersonaLive™ outperformed traditional segmentation.
If you’d like to learn more about PersonaLive™ and how to leverage it for your use case, simply contact us.
Reference
This post was inspired by How to Enrich POS Data to Analyze & Predict CPG Sales by Argyrios Kyrgiazos and the Carto team. We were impressed not only by the solid approach taken by Argyrios but also the quality of the data itself. We took the same methodological approach, but applied it as a test in our evaluation of the PersonaLive™ dataset, as compared to traditional segmentation and demographic variables.
What you should do now
Whenever you're ready, here are 3 ways Spatial.ai can help:
- See PersonaLive In Action. If you'd like to segment and target your best customers using real-time behavioral data, schedule a free 30-min demo to get started.
- Subscribe To Consumer Code. If you've found this helpful, check out our newsletter and podcast where we share more consumer research and insights for retail marketers.
- Share This Post. If you know another marketer who’d enjoy reading this post, share it with them on Linkedin, X, or Facebook.
Get retail marketing tips
We email every monday with smart growth strategy ideas. Almost no promotion. Just value.
.avif)
%20(1).jpg)