
Aritzia Brand Report
Case
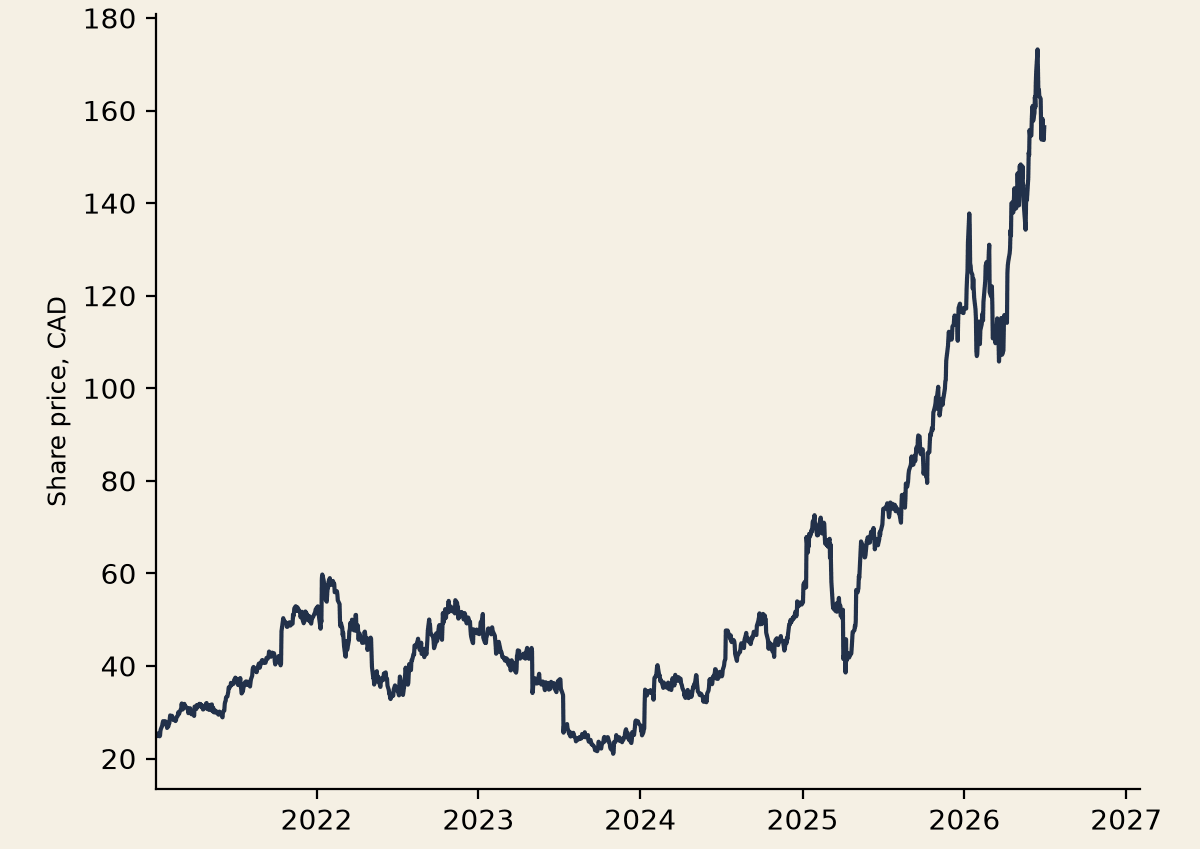
A growth story that stalled in 2023, rebuilt into six straight quarters above 30%, and repriced by the market from CAD $21 to CAD $173.
Unparalleled Performance
Revenue up 43.4% in the latest quarter, the sixth in a row above 30%, on a rebuild that began after the 2023 inventory stall.
Aritzia reported its fiscal 2027 first-quarter earnings on July 9, 2026, beating its own raised guidance on every line. Net revenue rose 43.4% to CAD $951 million, approximately USD $690 million. Comparable sales, the company's own measure covering boutiques open at least a year plus e-commerce, grew 35.1%, stacked on top of 19% growth the year before. In the United States, now two-thirds of the business, revenue grew 54.5%. Canadian comparable sales above 20% imply US comparable growth in the low-to-mid 40s. Digital revenue grew 55.5%. Adjusted EBITDA rose 81% to a record first-quarter margin of 20.1%, and adjusted earnings per share nearly doubled. Management raised its full-year outlook again, the sixth consecutive quarter it has done so. Starting in early 2025, Aritzia's reported revenue growth has run +31%, +33%, +32%, +43%, +33%, +43% in Canadian-dollar terms. Six straight quarters above thirty percent, in every channel and every geography.
EXHIBIT 1 — Six consecutive quarters of revenue growth above 30%
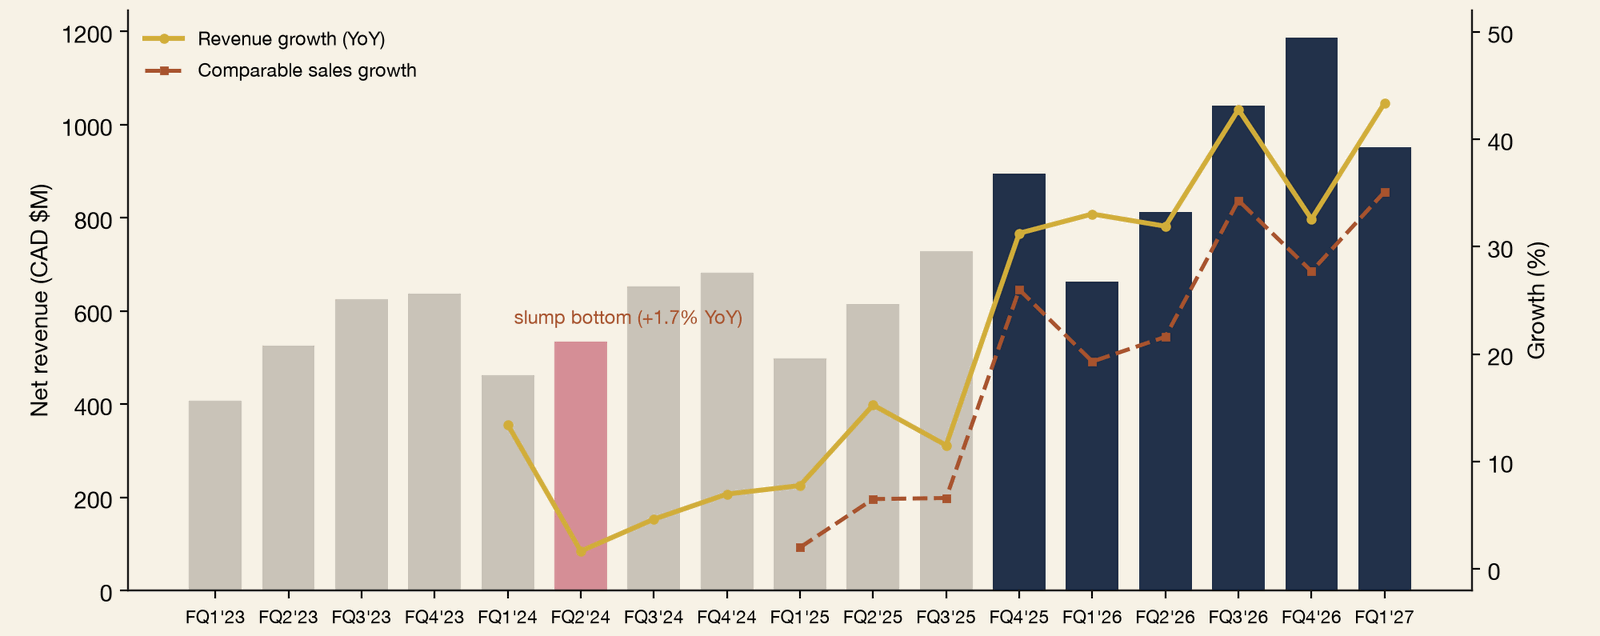
What makes the run remarkable is what sits in the middle of that chart. In 2023 Aritzia was a broken growth story, and the record of what went wrong is in the company's own filings. Freight schedules normalized after the pandemic and inventory arrived earlier and heavier than planned, concentrated in what management calls client favourites rather than new styles. Gross margin for fiscal 2024 fell to 38.5%, and the summer-2023 quarter grew just 1.7%. In July 2023 the company cut its revenue outlook and the stock lost a fifth of its value in a single day. Management spent two years rebuilding inventory discipline, and by fiscal 2025 an optimized inventory position was fueling a comparable-sales acceleration in every quarter of the year. Comparable sales went from +2.0% in mid-2024 to +35.1% in the most recent quarter. Gross margin went from 38.5% in fiscal 2024 to 50.3% last quarter. The same machine that stalled at +1.7% now prints +43%, and the interval between those two numbers was a rebuild, not a rebrand.
EXHIBIT 2 — The market repriced the rebuild: from CAD $21 to CAD $173
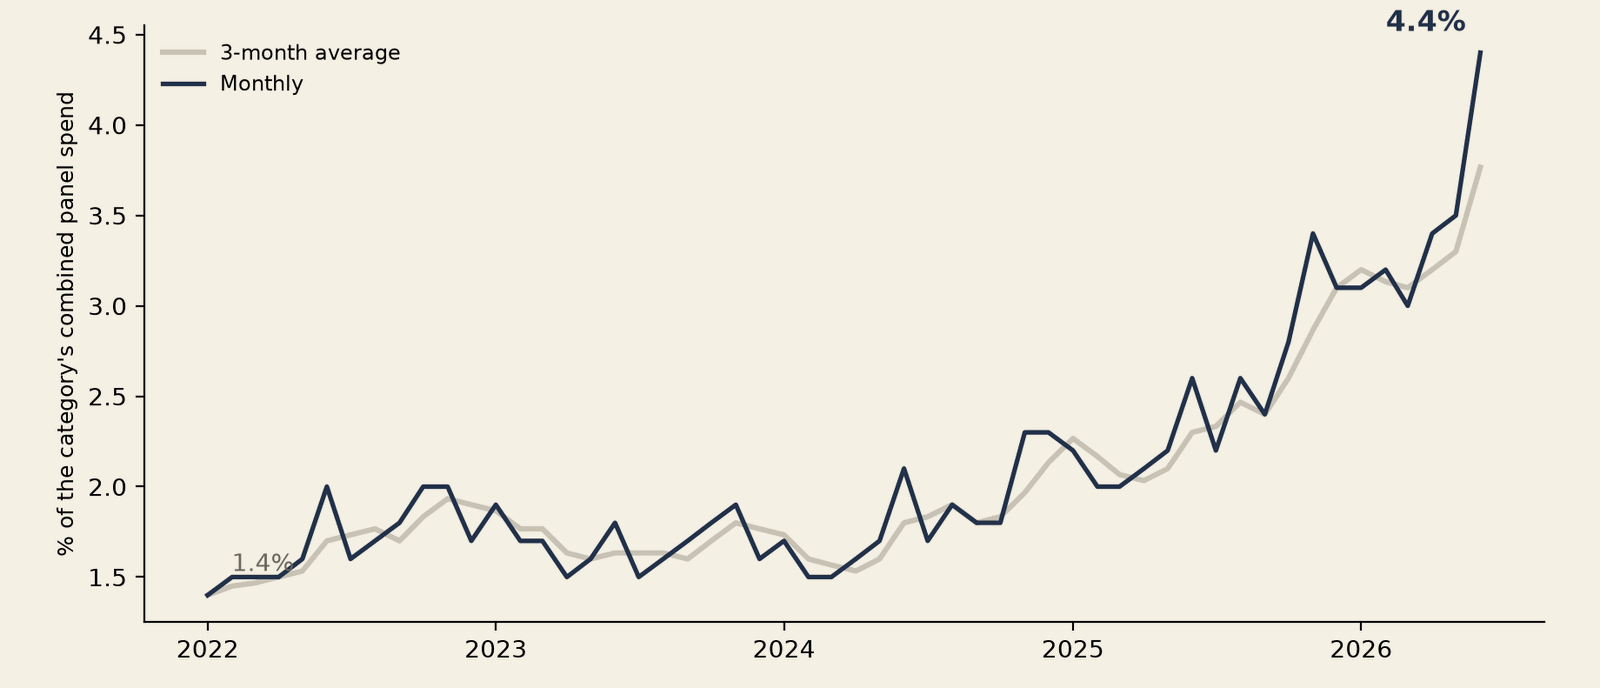
Measured against the category built from the brands where its customers predominantly shop, a set of 29 brands assembled later in the report as the Closet category, Aritzia's share of combined spend has gone from 1.4% in January 2022 to 4.4% in June 2026, on a three-month average of 3.8%.
EXHIBIT 3 — Aritzia's share of the Closet category rose from 1.4% to 4.4%
Over the full window Aritzia's US panel sales compounded at 33% per year. The Closet category compounded at 6.8%. The District category, the subset of those brands present around Aritzia locations, compounded at 7.4%. Aritzia is growing at nearly five times the pace of the brands that share its customer.
EXHIBIT 4 — Aritzia compounded at 33% a year against the category's 6.8%
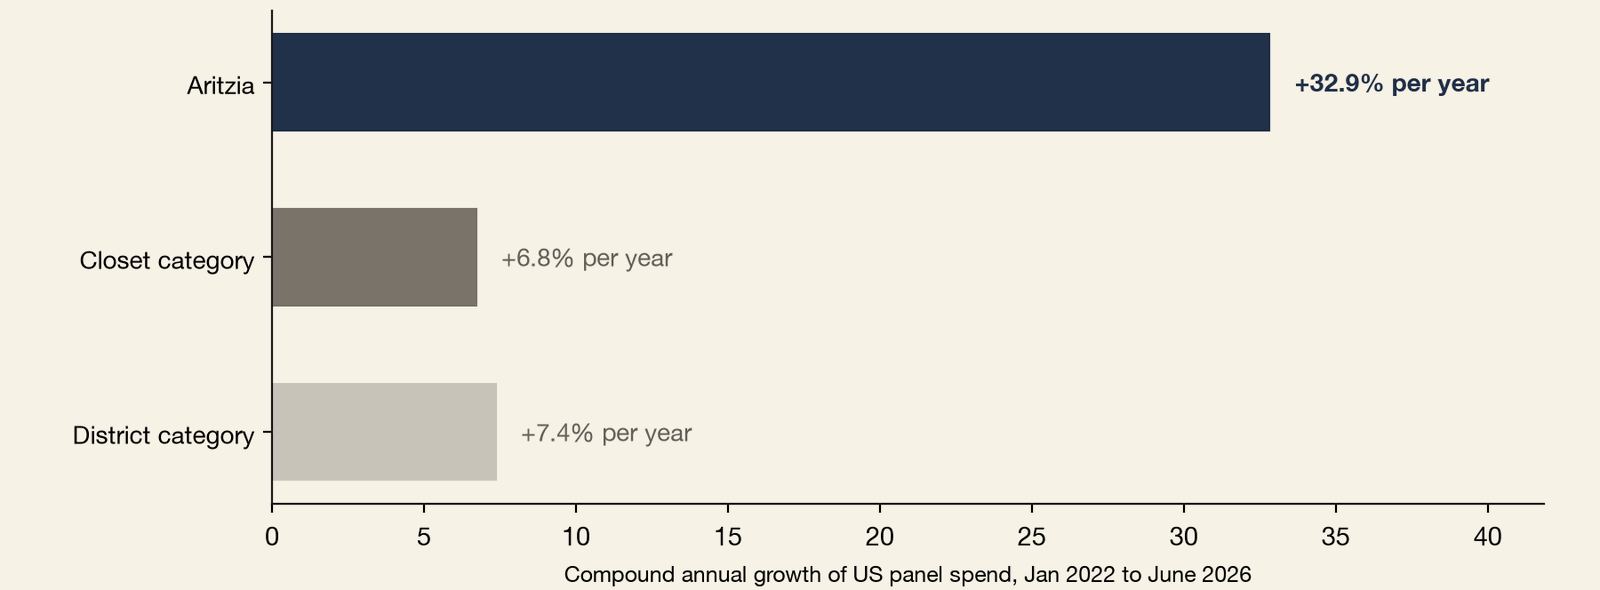
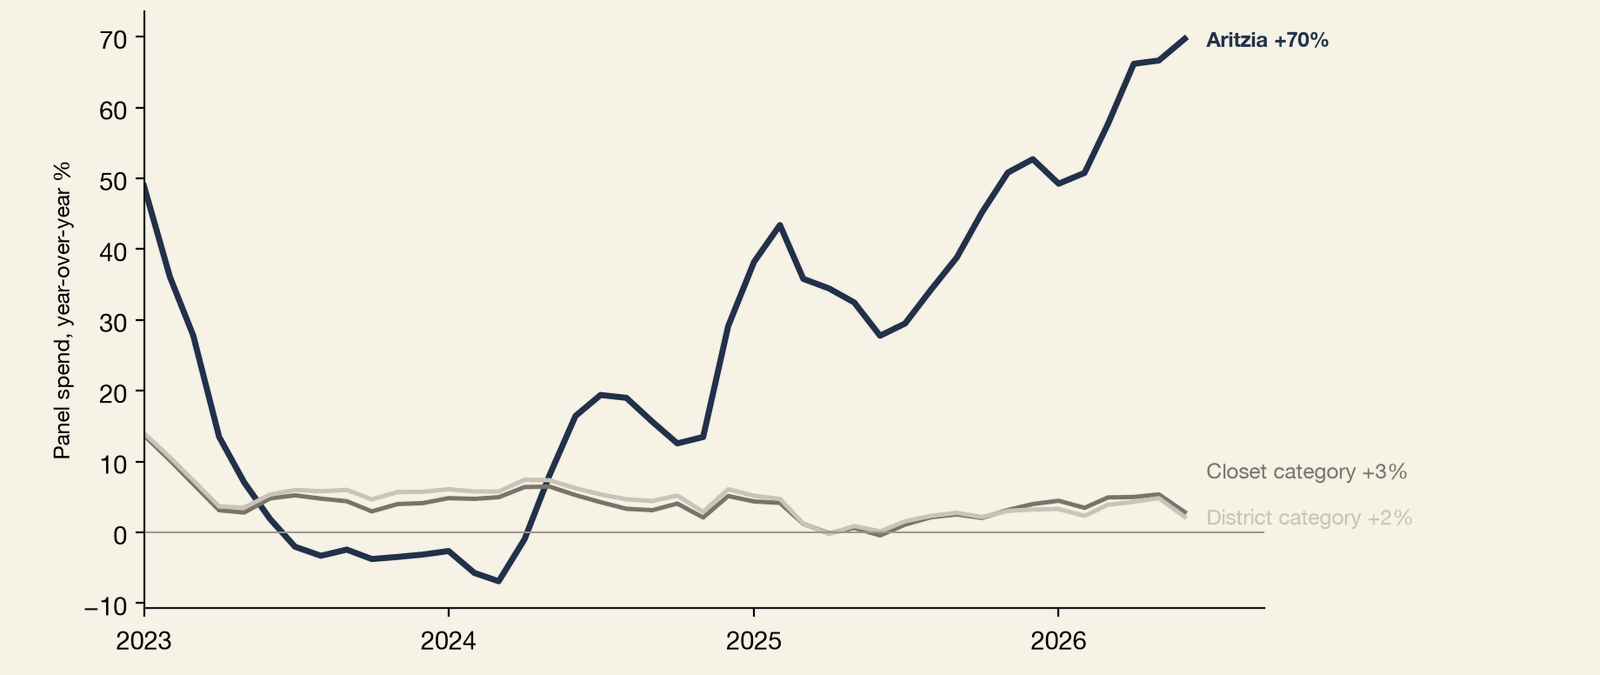
EXHIBIT 5 — The growth gap widened through every month of the run
The Model
Everyday Luxury as an operating model: 97% exclusive brands, $10 million boutiques finished above their price tier, and a digital business growing faster than the stores.
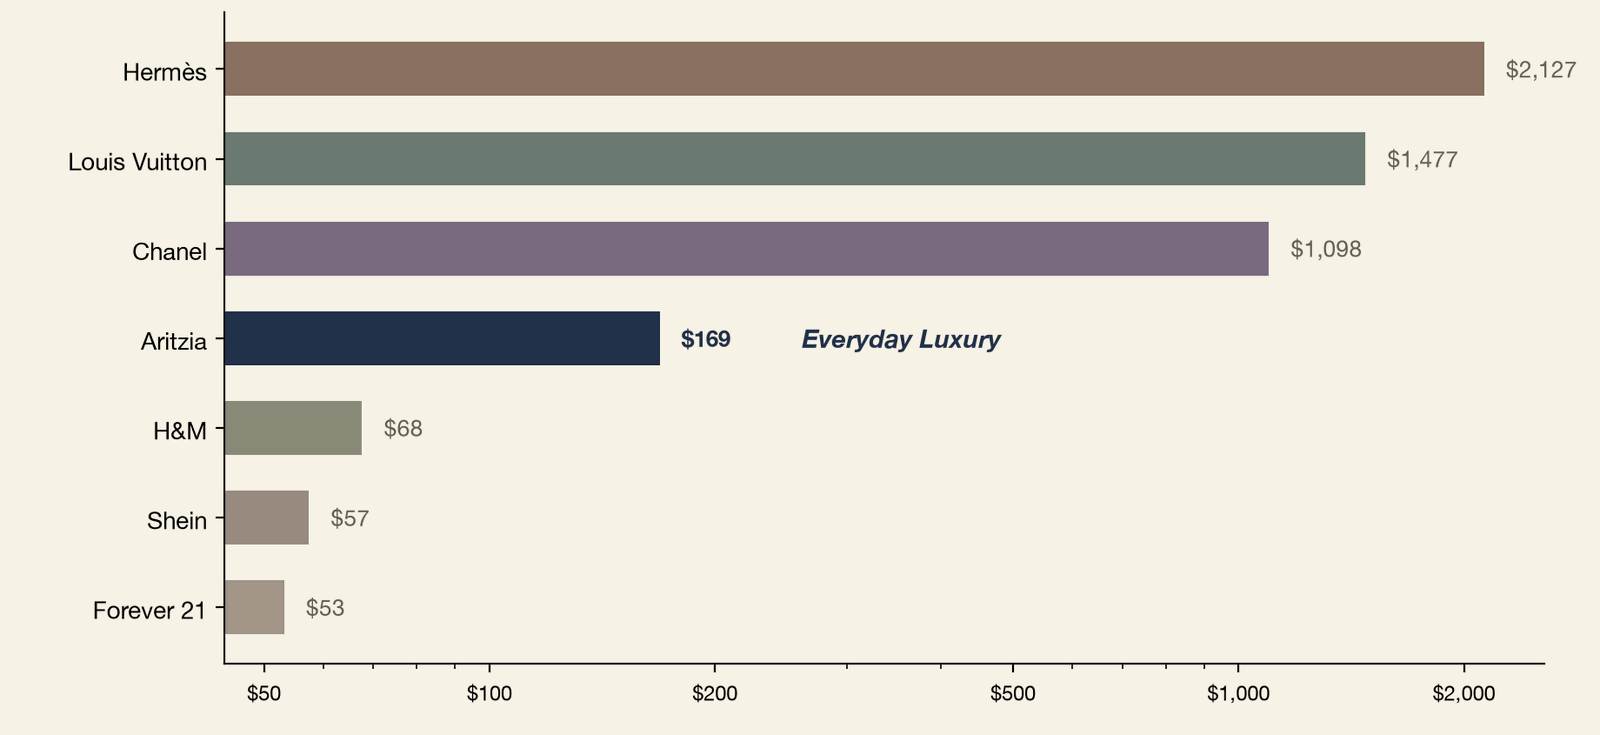
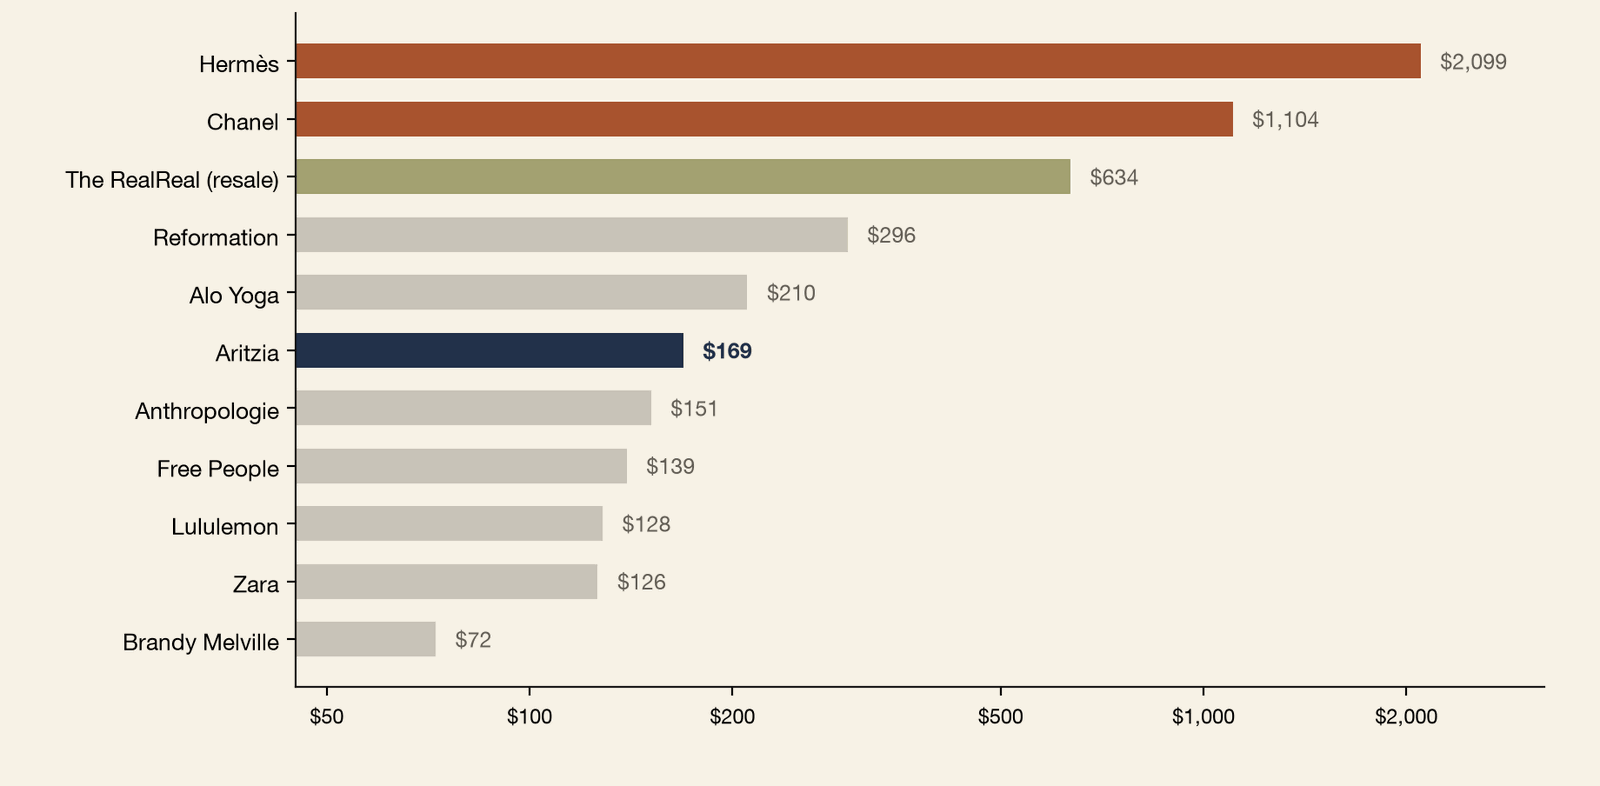
Everyday Luxury is Aritzia's trademarked slogan, and it names a position, not a product. A gulf sits between fast fashion and true luxury. At the bottom, a Shein transaction averages $57 and a Forever 21 transaction $53. At the top, a Chanel transaction averages $1,098 and an Hermès transaction $2,127. Aritzia's $169 sits in the space between, near the top of the contemporary tier, and almost nothing else trades there. A brand that can make $169 feel like the bottom of the luxury shelf rather than the top of the mall has that space to itself. Brands selling a premium experience at a mid-tier price have consistently outperformed in the strained-consumer era, and Aritzia is the purest apparel expression of it.
EXHIBIT 6 — At a $169 average ticket, Aritzia trades in a gap the rest of apparel leaves empty
Approximately 97% of Aritzia's net revenue comes from brands it owns. Wilfred, Babaton, Tna, and the rest are not acquired labels or licensed partners. Aritzia's own teams design, plan, source, produce, and retail them in Vancouver. Each carries what the company calls its own vision and distinct aesthetic point of view, aimed at a different part of its client base. That combination is rare in apparel retail. Single-brand verticals such as Zara or Reformation own their product but sell it under one name. Department stores surrender most of the margin to third-party labels, and their own brands are a minority of what they sell. Conglomerates like URBN own several brands but run each as a separate banner. Within the Closet category, no other member runs multiple distinct labels at near-total ownership. The shopper experiences a curated designer boutique while the income statement records private label at a vertical margin. The remaining three percent is a deliberately thin layer of bought-in product, premium denim, footwear and accessories, to round out the assortment. The practical effect is that Aritzia can chase several aesthetics at once without diluting any of them, and can reallocate space between brands as taste moves.
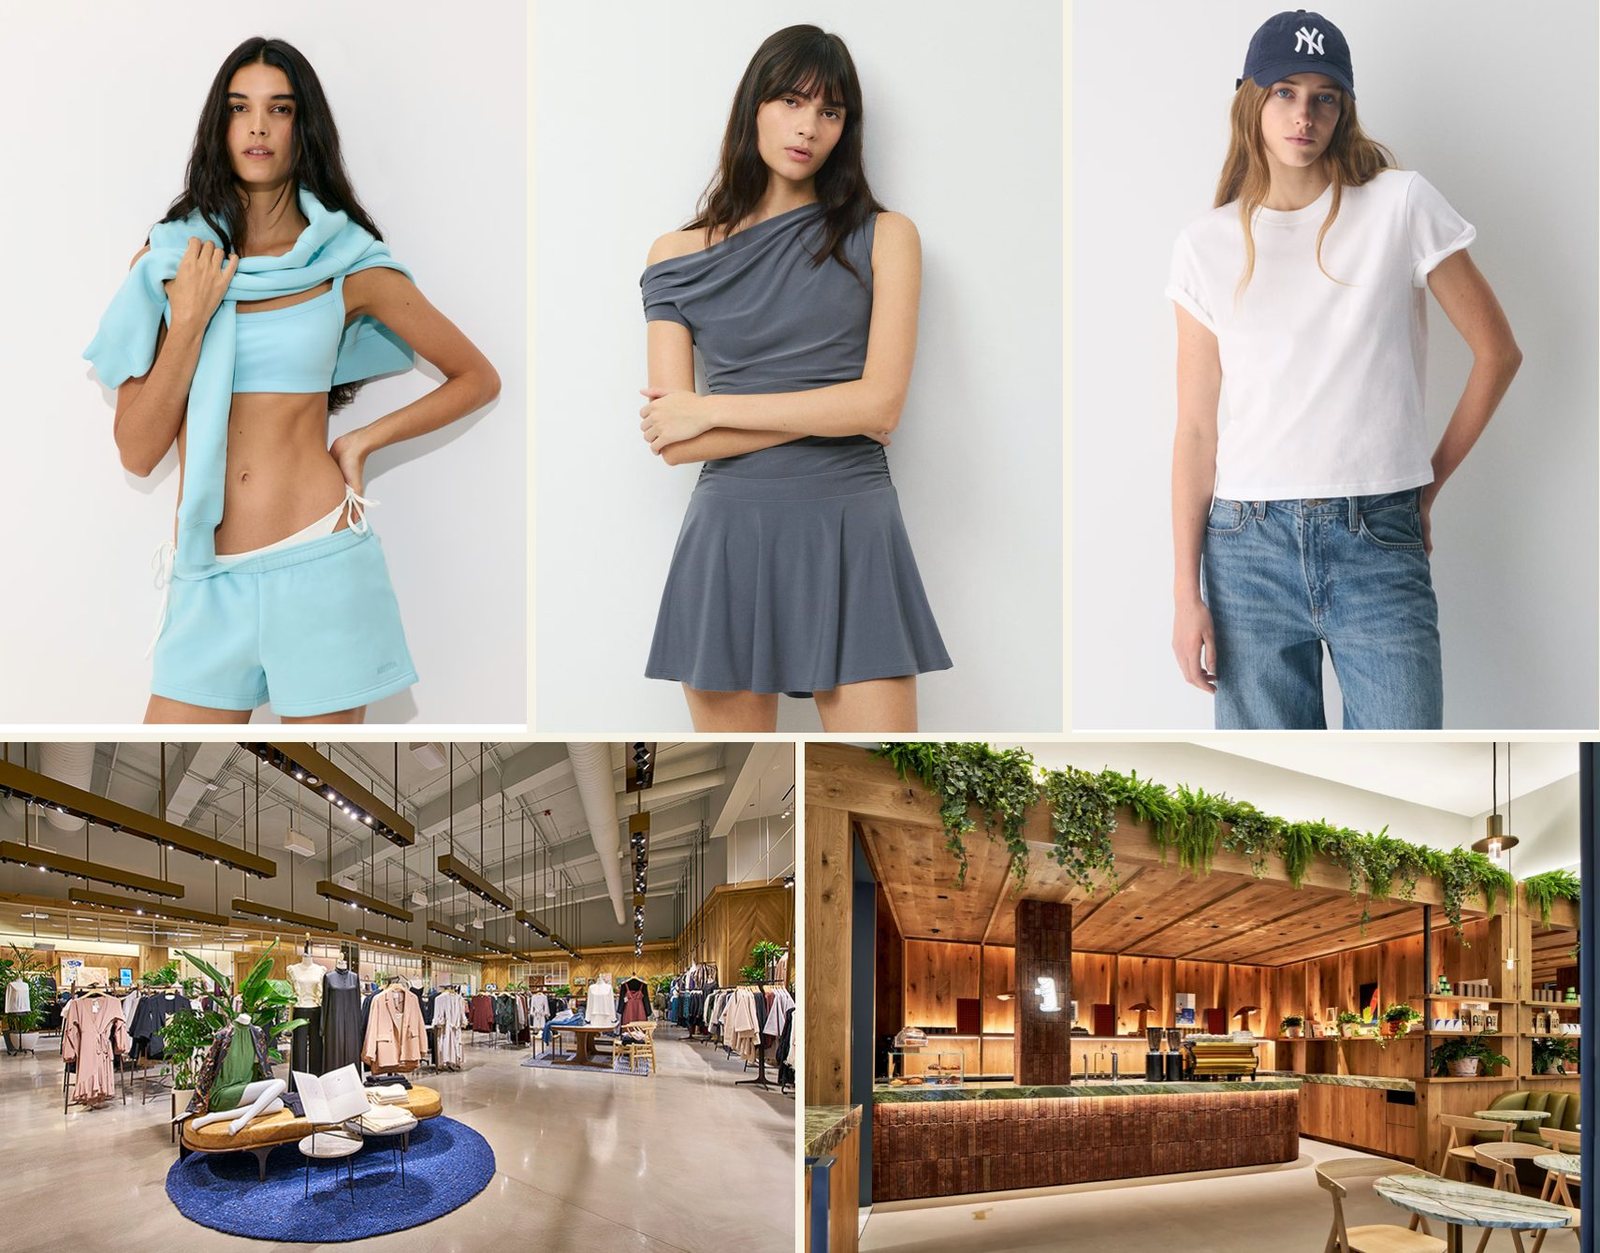
The stores are the other half of the model. The average boutique has grown from six thousand to more than ten thousand square feet over a decade, finished to a standard that reads several price tiers above the merchandise, with espresso bars, the A-OK Café, now a disclosed element of boutique strategy. A standard new boutique produces roughly $10 million in annual revenue on that footprint, about $1,000 per square foot, and pays back its investment in twelve to eighteen months on the company's math. Analysts model under twelve months for recent United States openings. Above the standard boutiques sits a layer of stores three to four times that size, added at a remarkable pace. Three New York-area openings within three weeks of late 2025, and in the same month a 46,000-square-foot store, Aritzia's largest, on Chicago's Michigan Avenue, the largest lease signed on the Magnificent Mile in roughly a decade.
Digital is no longer the junior channel. In fiscal 2026 the company merged its eCommerce, omnichannel, performance-marketing and concierge units into a single Digital business. It launched the Aritzia App the same year. It finished a rebuilt aritzia.com designed to integrate with the app. The results arrived fast. Digital revenue grew 58% in the holiday quarter and reached 41% of company revenue, then grew 55.5% last quarter, faster than the stores it complements.
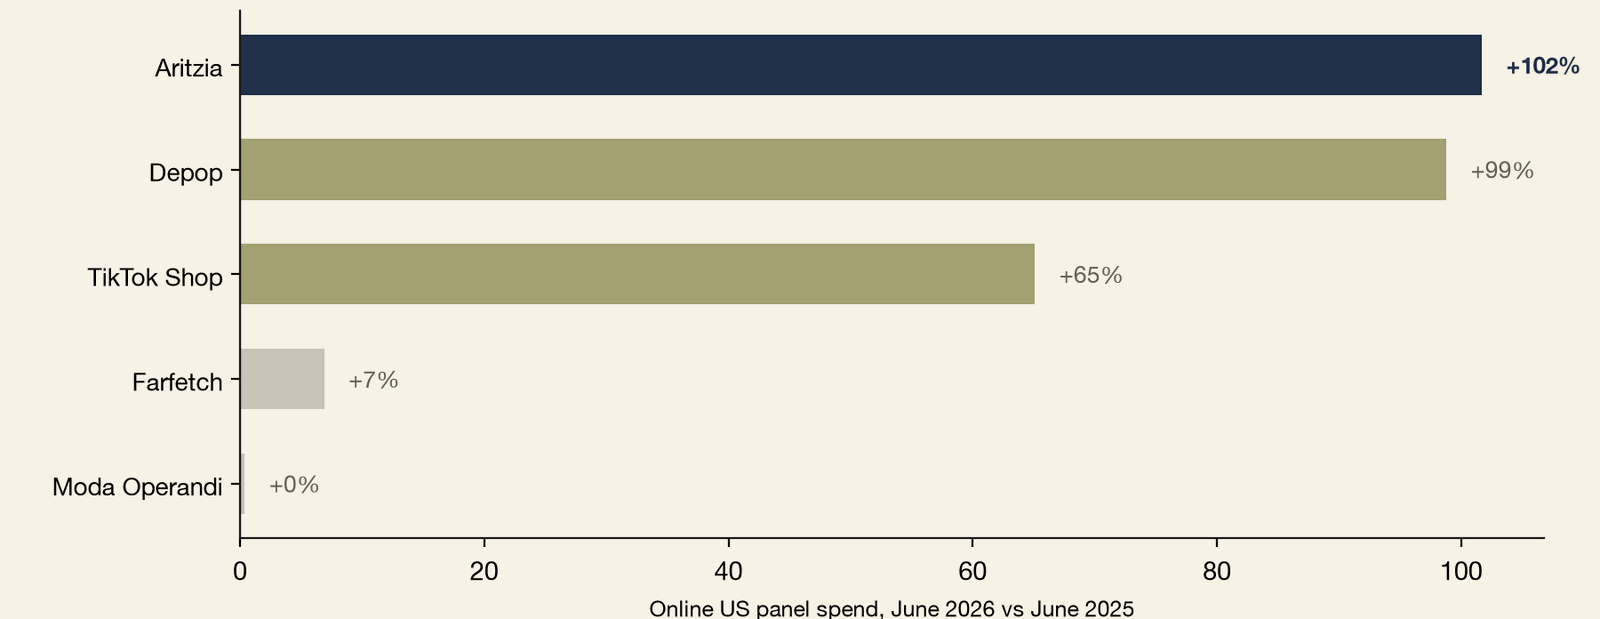
The rest of online fashion moved the opposite direction. The multi-brand platforms that sit between brands and shoppers split into two fates. The luxury resellers collapsed, with Farfetch rescued from insolvency, Matchesfashion shut down after entering the UK's insolvency process, and Net-a-Porter's parent broken up. The intermediaries that grew are discovery platforms rather than merchandisers, led by TikTok Shop. Customers still browse through intermediaries, but they no longer buy full-price fashion from them. The transaction moved to social platforms or directly to brands. Aritzia built itself for that world.
EXHIBIT 7 — Aritzia's online spend grew 102% while the luxury middlemen went flat
The Malls
Premium retail space is close to sold out, landlords now choose their tenants, and Aritzia is taking the space the department stores leave behind.
Aritzia operates almost exclusively at the top of American retail property, and the top is close to sold out. National retail availability is near 4.9%, the lowest since CBRE began tracking in 2005. The main driver is supply. Developers have added almost nothing since the financial crisis; completions hit a 20-year low in Q1 2026. Within that fixed supply, the strongest and most valuable properties, the small set of malls and street corridors that command the highest sales and rents in America, are the tightest of all. Aritzia's expansion runway is constrained by its own standard for retail space and by how little of the best space exists.
Scarcity flipped the power structure of the business. Leverage has returned to the property side. Prime space reprices upward on renewal, concessions have collapsed, and tenants in the strongest submarkets are accepting the longest lease terms of the post-COVID era. Premium landlords now curate their tenant lists, and they are picking Aritzia. Of Aritzia's 77 US boutiques, 88% sit in top-tier properties, including seven of the country's ten highest-productivity malls. A boutique producing $1,000 per square foot runs above what even the best malls average, so an Aritzia lease improves the property's own standing.
The space is coming from the old guard. Saks Global, parent of Saks Fifth Avenue and Neiman Marcus, filed for Chapter 11 in January 2026. Macy's is closing roughly 150 stores through 2026. Forever 21's liquidation handed hundreds of storefronts back to landlords; Aritzia has been filling those vacancies. Its Michigan Avenue store occupies a former Gap, and its four-level, 40,000-square-foot Vancouver store, opening in 2027, occupies a dead Nordstrom.
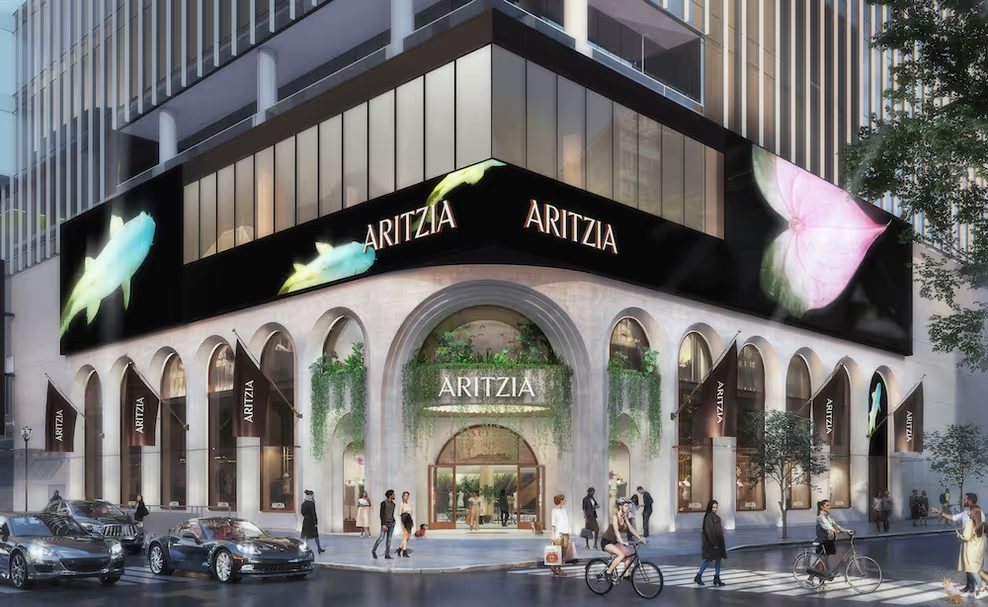
The map of vacancies worth filling is moving south. Six of the seven fastest-growing states since 2020 are Southern, and the fastest-growing retail markets in the country are now Sun Belt metros minting exactly the household incomes Aritzia sells to. All four of Aritzia's new markets this fiscal year are Southern, each in the dominant premium property of its metro. Management's stated potential of 180 to 200-plus US boutiques, against 77 today, depends partly on the premium-property map continuing to rotate south, with Aritzia taking the best space in each new metro as it does.
Origins
Forty-two years of one idea, from a single Vancouver boutique in 1984 to a founder-governed public company, with no pivot along the way.
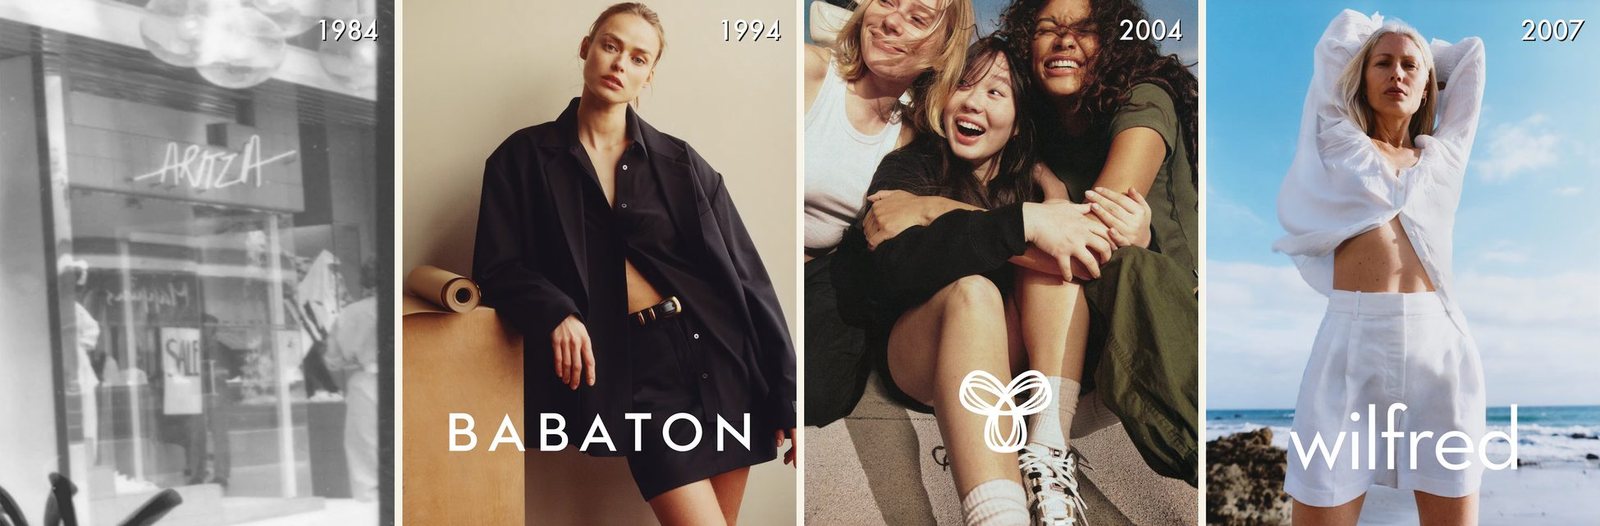
None of this is a pivot. Aritzia has been rehearsing for this market for forty-two years. The in-house labels are decades old, their branded messaging was established early, and the company has never left either one. What changed is that the market arrived at the position. Brian Hill was a third-generation Vancouver retailer whose family ran Hills of Kerrisdale, a department store dating to 1914. He opened the first Aritzia boutique in 1984 inside Oakridge Centre on Vancouver's west side. The founding idea was already the wedge. Clothes that looked and felt more expensive than they were, for young women with taste ahead of their income. The exclusive brands came early, with Talula Babaton in 1994, Tna in 2004 and Wilfred in 2007. The company reached national Canadian scale by the late nineties, entered the United States in 2007, launched e-commerce in 2012, and listed on the Toronto exchange in October 2016 at CAD $16 a share to a shrug. The stock spent its first year below the offer price. Jennifer Wong, the current CEO, joined the first boutique in 1987 as a part-time sales associate. Hill remains Executive Chair and controls the company through multiple voting shares. It is a founder-governed mall specialist that compounded patiently until the market arrived at its position.
Customers
Wealth and youth at once: a quarter of revenue from households above $250,000, a third from customers under 35, and one woman at every stage of her life.
Aritzia's filings never describe its customer. The disclosure documents, every management discussion and every annual report, contain no age range, no income band, no demographic of any kind. The one definition the company ever published, "women aged 15 to 45," comes from its 2016 IPO documentation. Since then, customers have been referred to only as "our clients." Aritzia never discloses who "she" is. The company references her only through performance metrics, an active US client base that grew roughly fivefold from fiscal 2020 to fiscal 2025, and roughly threefold in the four years to fiscal 2026.
The two coordinates
Where Aritzia's revenue comes from by household income and by age, and why holding both extremes at once is rare in apparel.
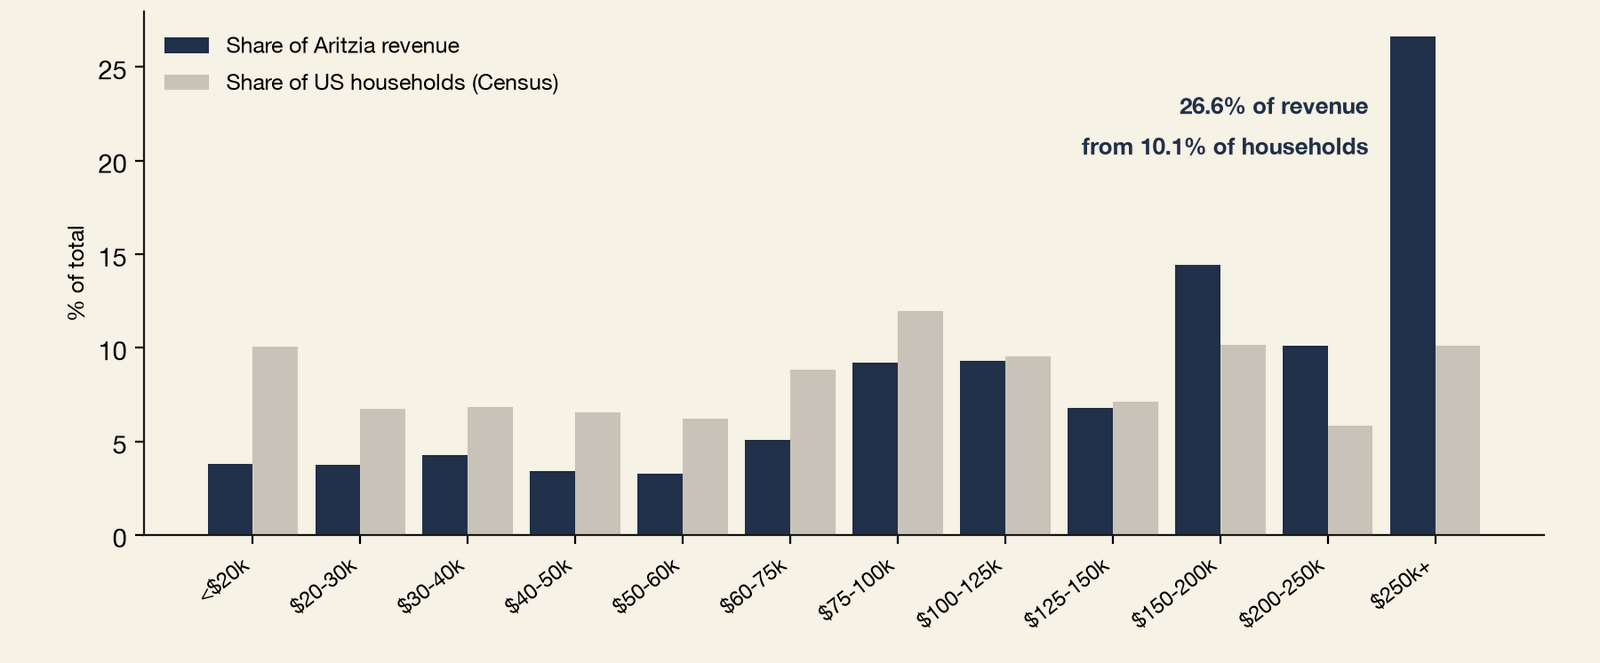
Over the trailing year, 26.6% of Aritzia's US panel revenue came from households earning more than $250,000. Those households are 10.1% of the country. Over the same period, 34.7% of revenue came from customers aged 18 to 34. That level of wealth concentration usually comes with an older customer base. Youth concentration of that degree normally comes with a lower-earning one. Aritzia holds both at once, and at extremes. Households earning $250,000 to $500,000 buy at nearly five times their respective share of the population, and households above $500,000 at more than eleven times. The over-indexing holds for the age groups as well. Customers 18 to 24 buy at almost four times their respective share, and customers 25 to 34 at twice.
EXHIBIT 8 — Households above $500,000 buy Aritzia at eleven times their share of the country
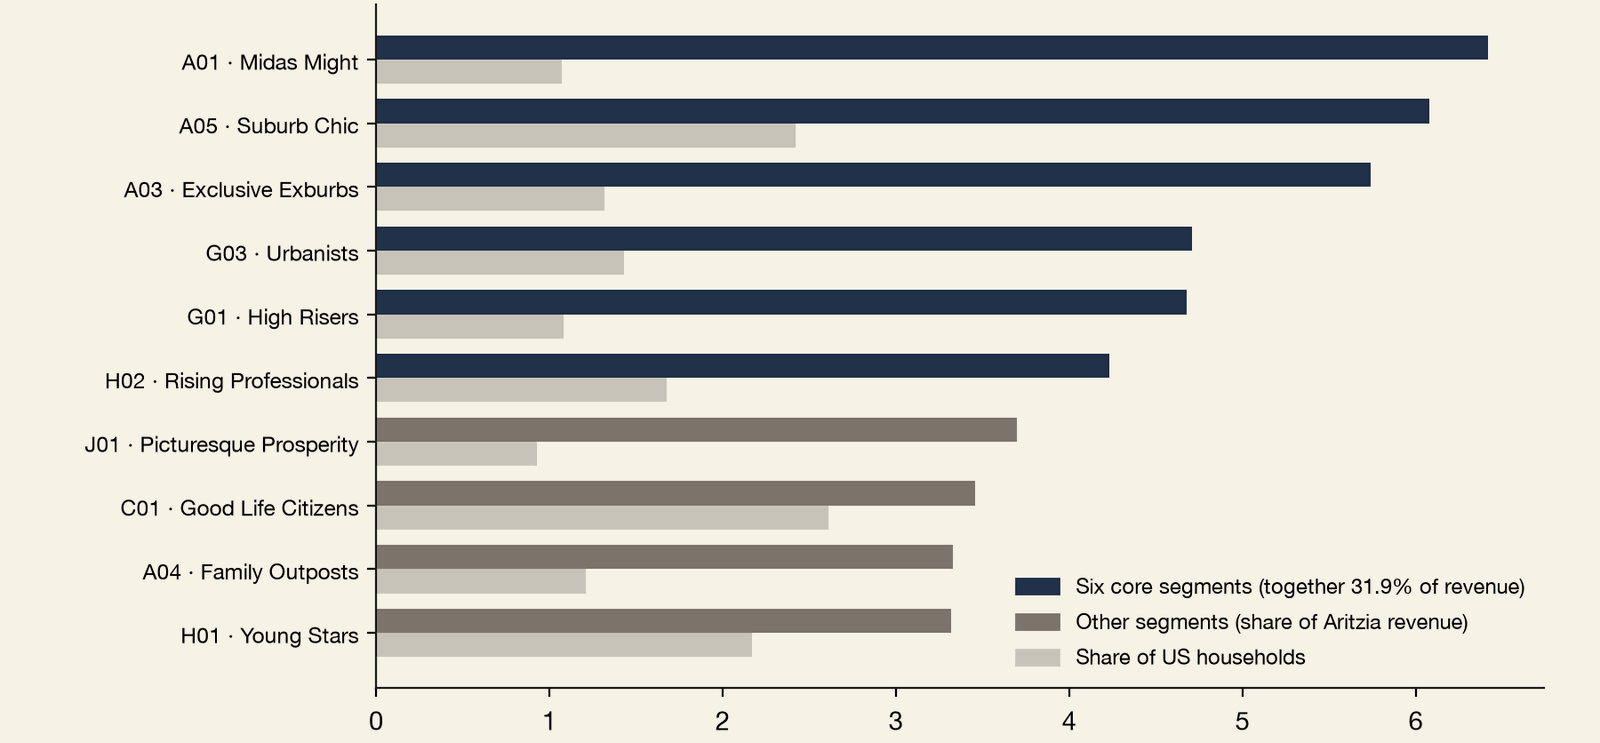
80 PersonaLive segments make up the American consumer household base. Six of those, roughly 7% of US households, account for 31.9% of Aritzia's revenue. A single segment, only 0.65% of households, is purchasing at six times its weight, making it the segment with the largest share of Aritzia sales in the country. The company has described its assortment as designed "to reach many different groups of clients." The reach is real, but the buying concentrates in a specific customer, found in a small number of places, at very high intensity.
Who she is
The six PersonaLive segments, about 7% of US households, that supply 31.9% of Aritzia's revenue, split between estate households and urban renters.
That 31.9% of revenue, the share coming from those six segments, breaks into two groups that together define her.
The estate half. Half of the segments making up that share are wealthy family households: Midas Might, extremely wealthy families in large estate homes and the single largest source of Aritzia revenue in the country; Suburb Chic, the affluent close-in premium suburbs; and Exclusive Exburbs, the high-income enclaves on the city's edge. These are households headed by adults 45 to 54, with income of $200,000 and up, homeownership near 90%, and children present at rates a third above the national average. The demographics describe a Gen X homeowner. The buying does not. Nearly a third of Aritzia's revenue books to these households, and it is not Gen X men purchasing womenswear. It is the household's women transacting on the household's card, a teenage daughter whose taste forms while a parent pays, and the established woman the household is built around. Different people, one appeal reaching both.
The renter half. The other three segments hold the same customer profile at her career stage: High Risers, the highly paid young professionals of the densest city blocks; Urbanists, young renters in the gentrified neighborhoods of first-tier cities; and Rising Professionals, college graduates renting in the trendiest parts of town. These segments are 25 to 34, single, degreed at twice the national rate, almost entirely urban, and overwhelmingly renting. The customer here is on her own card and her own lease.
EXHIBIT 9 — Six PersonaLive segments, about 7% of US households, supply 31.9% of revenue
The Urbanist proof
Young renters living inside luxury's geography window-shop Chanel and Louis Vuitton at the same rate as Aritzia, and buy Aritzia.
The Urbanists segment is the clearest picture of who she is and of Aritzia's positioning. The segment's median household income sits near $110,000. Four in five rent. She appears in the country's most expensive housing markets. The San Francisco Bay Area alone holds 6.8% of the segment's households, twice the weight of any other market, with Boston, Washington, DC, and Los Angeles sitting below it. She lives inside luxury's geography on a contemporary income.
The map's one door outside the shading makes the same point from the other side. Corte Madera is not Urbanist geography. It is estate geography. The median household there earns above $230,000, the median resident is in her mid-forties, and surrounding Marin County holds the highest per capita income in California. The renter half explains four of the five Bay Area doors. The estate half explains the fifth.
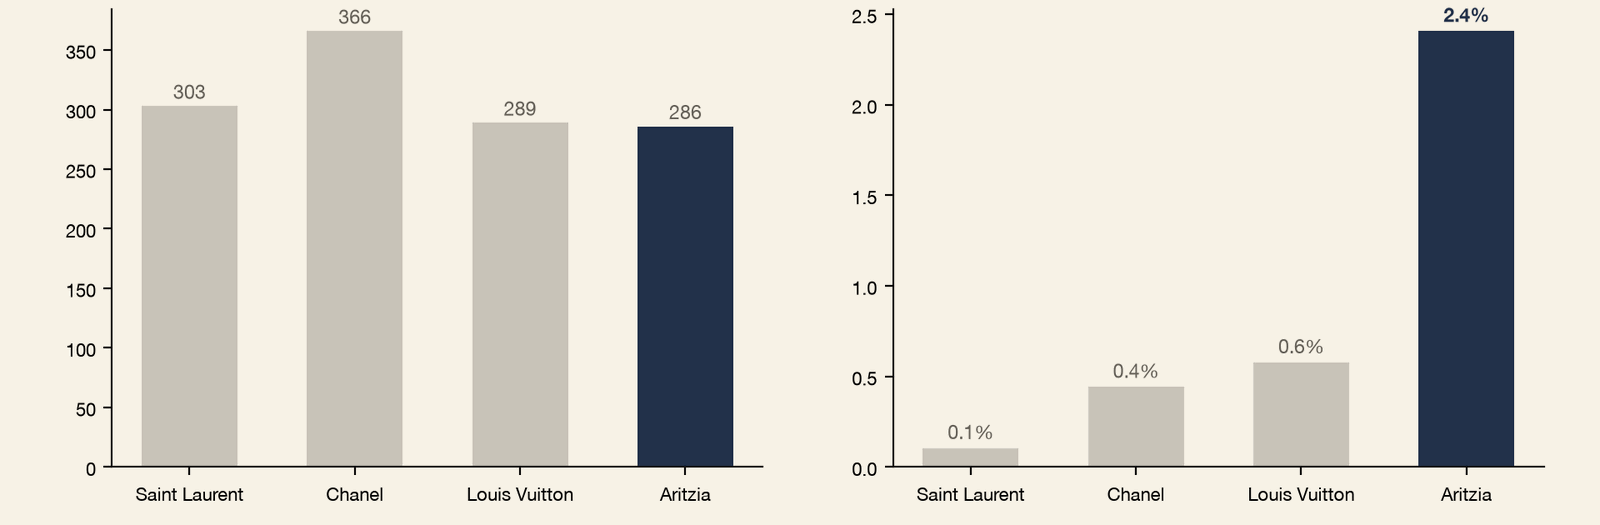
Her own movement shows what she does with that address. In California, Urbanist households walk into Saint Laurent, Chanel, and Louis Vuitton storefronts at roughly three times the average consumer's rate. They walk into Aritzia's at the same rate. The purchases split. Over the trailing year, 2.4% of California's Urbanist households bought at Aritzia, against 0.1% at Saint Laurent, 0.4% at Chanel, and 0.6% at Louis Vuitton. She window-shops them all alike. She buys Aritzia. That is the Everyday Luxury proposition, stated in her own behavior.
EXHIBIT 10 — The Urbanist's map is Aritzia's map
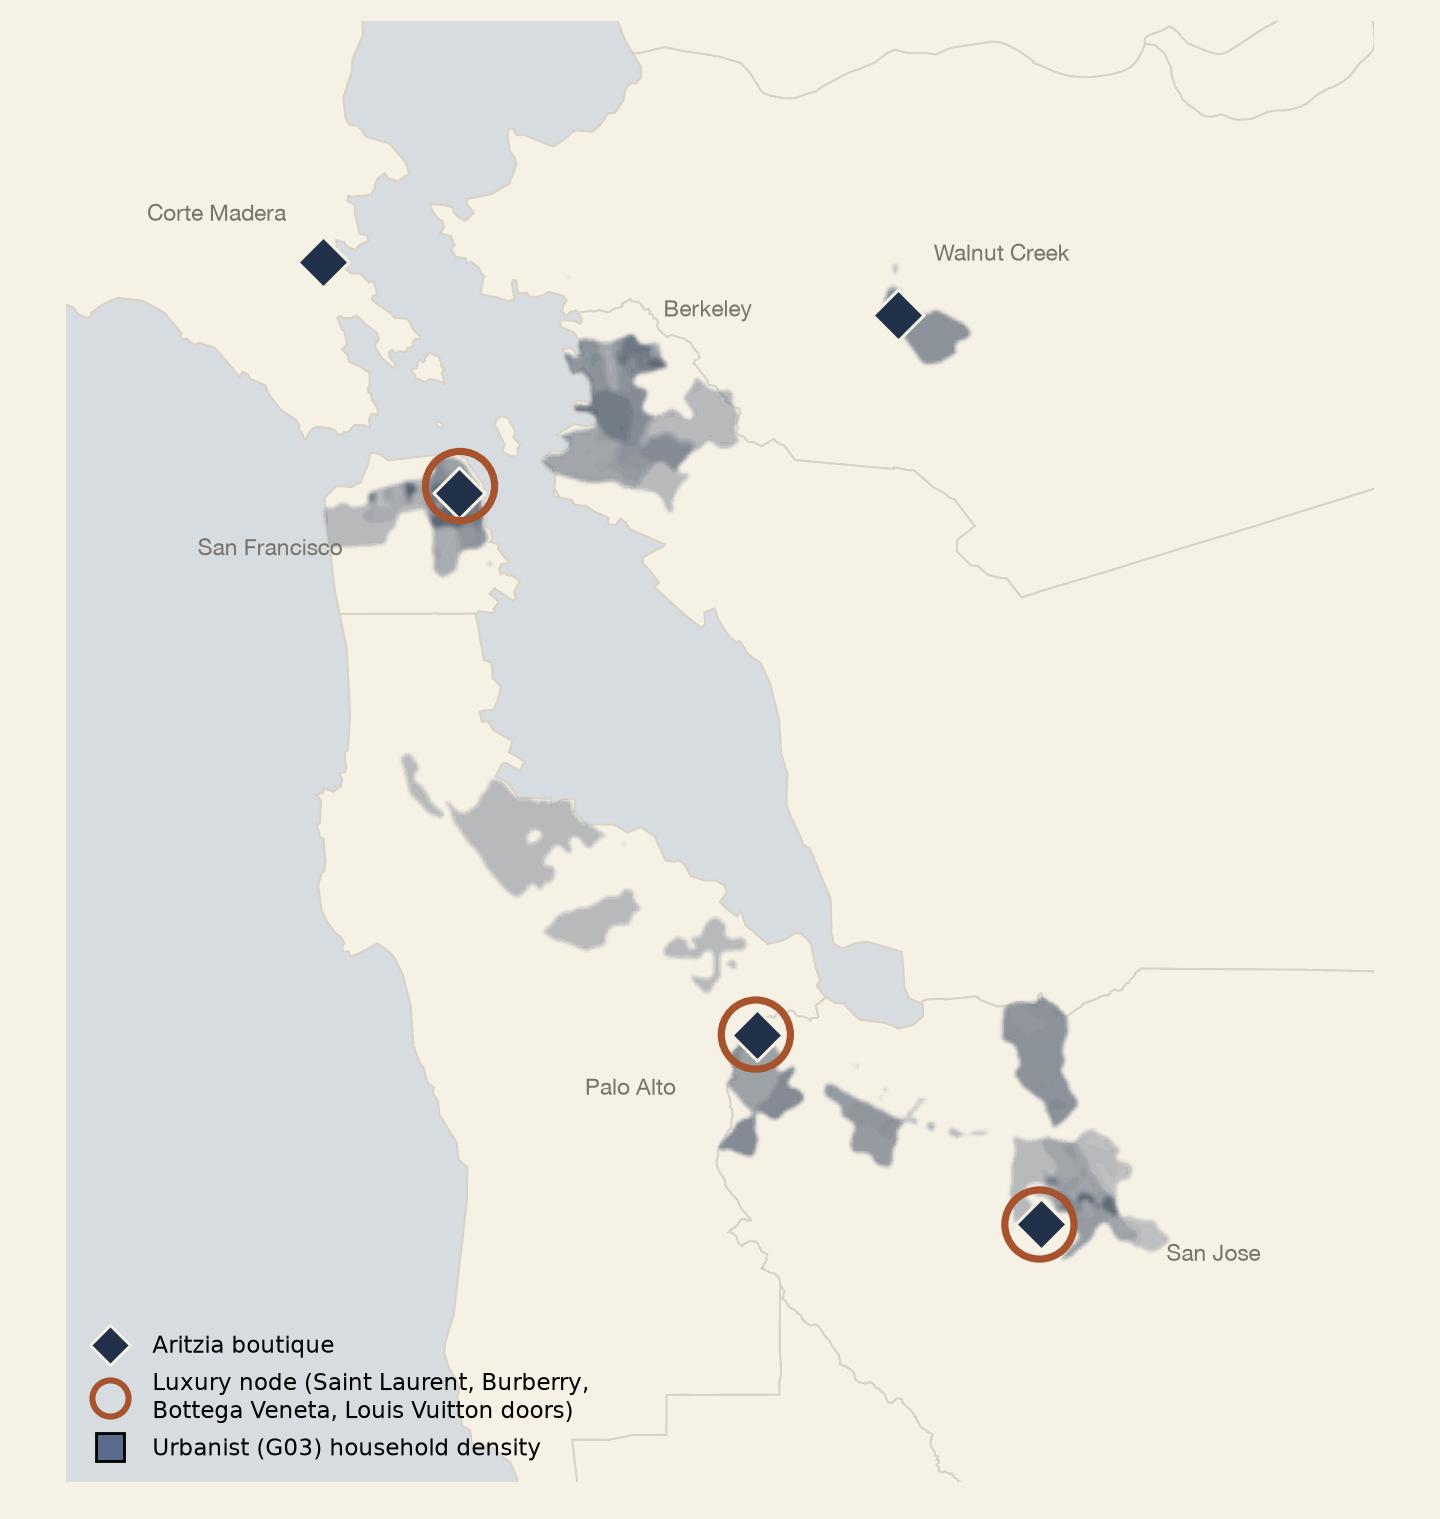
EXHIBIT 11 — California Urbanists visit luxury storefronts at the same rate they visit Aritzia, and buy at four to twenty times the rate
One profile, every stage
How the label architecture and the spend data track one customer from a teenager on the household card to the household she later heads.
Read together, the segments show Aritzia capturing its customer at every stage of her life. Taste for the brand forms in the teenage years, on the household's card. Her own card arrives with the first job, in the trendiest zip code a starting salary allows. The renter years follow, mid-career, in the neighborhoods described above. The estate suburbs close the arc, where the household she now heads buys at the highest intensities the panel records, and where a daughter's first pieces go on the household card. The filings' description of clients served "across various aspects of their lifestyles and stages of their lives" reads here as an operating fact rather than brand language. She does not age out of Aritzia.
The label architecture follows the same arc. TNA, "for the innately cool," dresses its beginning. Babaton, "atelier-inspired design, luxe fabric and precise tailoring. The modern uniform," dresses its professional peak.
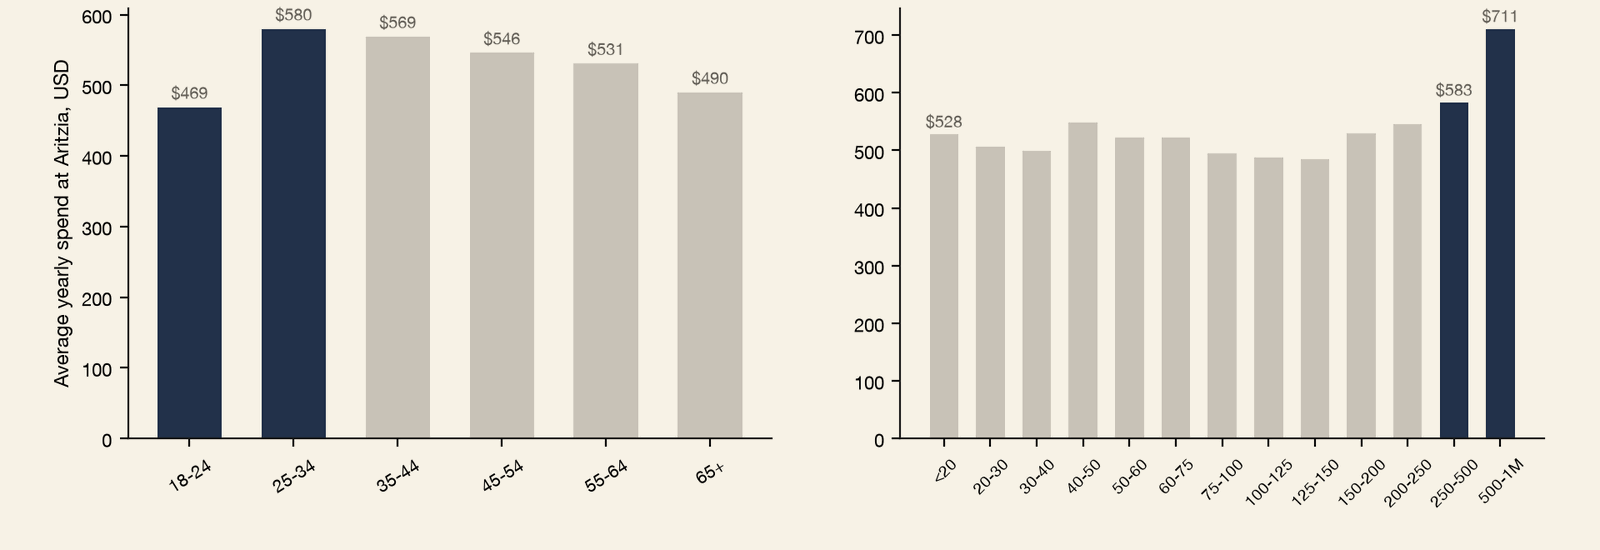
Spend per customer runs in the same direction. A customer aged 18 to 24 spends $469 a year at Aritzia, 87% of the brand average, on a fraction of the income of the customers above her. Spending then rises with the arc, through the 25 to 34 core to the wealthiest households on the books at $711 a year. Each stage outspends the one below it, and the youngest customers are already spending near the brand average years before their incomes justify it, consistent with consumer research finding Gen Z outspends its predecessors at the same age. If both patterns hold, today's youngest customers will reach the top of the arc as bigger spenders than the households there now.
EXHIBIT 12 — The youngest customers already spend 87% of the brand average
How she changed
Between 2022 and 2026 the age mix flattened around the core, the affluent share held at 26% to 29%, and the entry point widened.
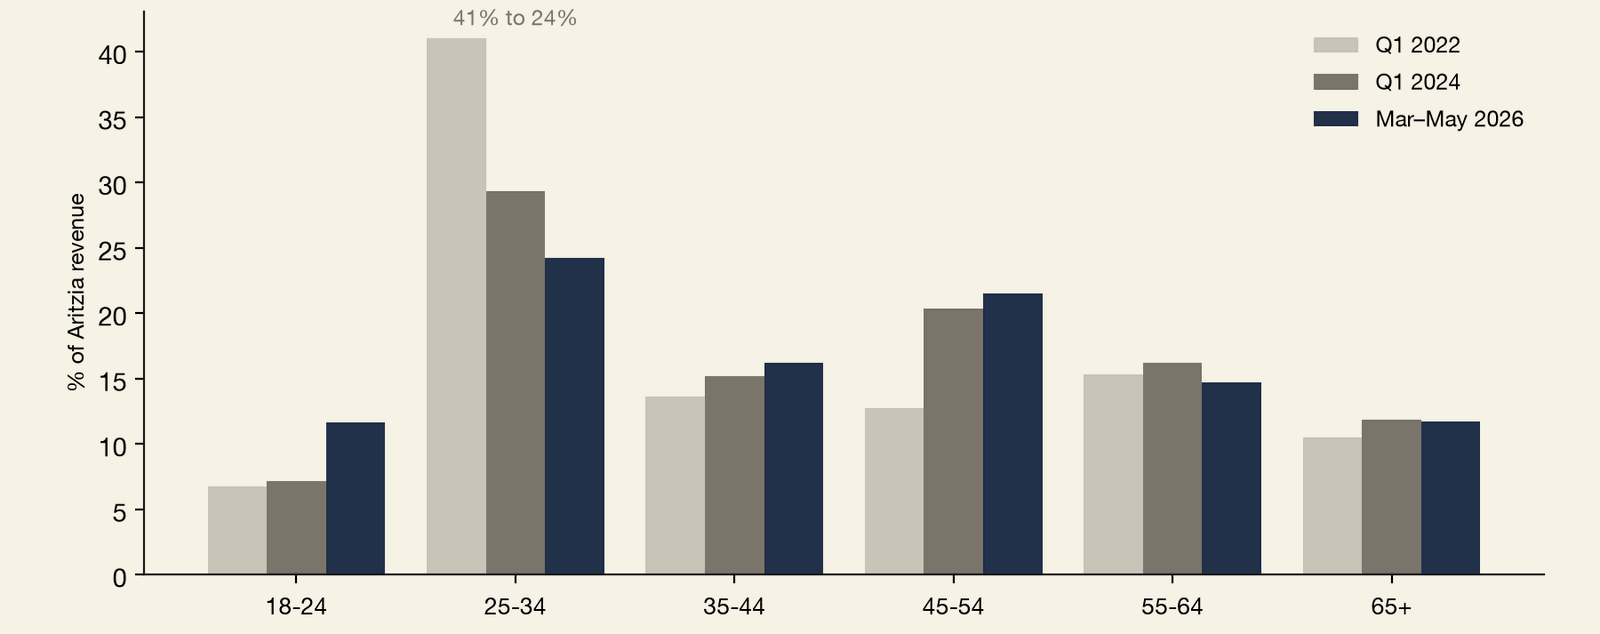
In the first quarter of 2022 the customer base was substantially one profile at one age. Customers 25 to 34 supplied 41.0% of Aritzia's US panel revenue. By spring 2026 that band supplies 24.2%, and the bands around it have converged toward it. The 18 to 24 share nearly doubled to 11.6%, the early edge of a generational adoption running through this category, and the 45 to 54 share rose from 12.7% to 21.6%. No band shrank in dollars. Panel sales roughly tripled over the period. Spending by customers 25 to 34 grew 1.8 times, and spending by the youngest and oldest bands grew more than five times each. The pattern is consistent with customers staying as they age while new ones enter behind them. The base did not rotate to a different customer. It lengthened along the arc it already occupied.
EXHIBIT 13 — The single-age peak of 2022 flattened as every band converged on the core
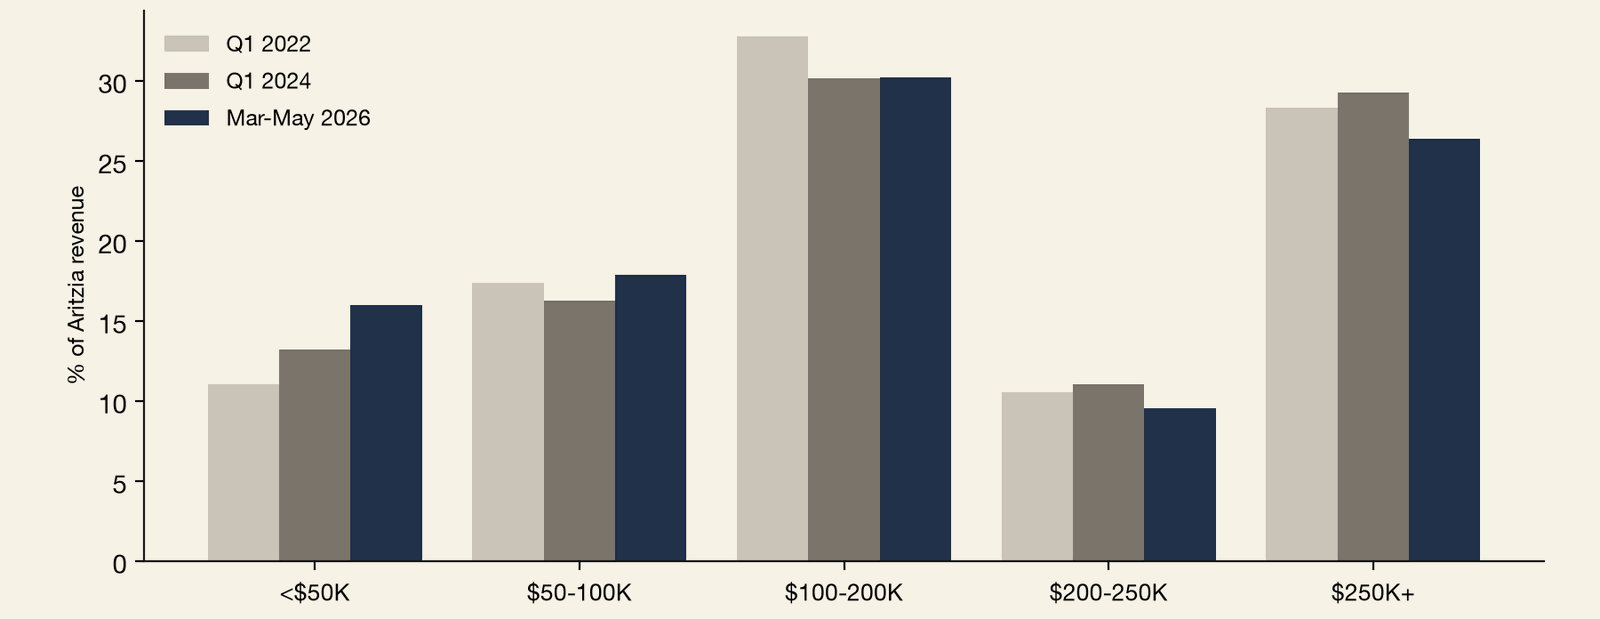
The income story carries the durability test. During a period when Aritzia's US panel sales roughly tripled, the $250,000-plus share of revenue held between 26% and 29%. The wealth tail grew at the same pace as the brand, neither diluted by the new volume nor dependent on it. The broadening at the edges is real. Sub-$50,000 households rose from 11% to 16% of revenue over the four years, the fastest relative growth in the mix, consistent with the youngest customers arriving on their own early-career cards. The affluent core held. The entry point widened.
EXHIBIT 14 — The affluent core held at 26% to 29% while the entry point widened
What she looks like from here
The forward customer is already in the base, one stage further along, and the contents of her closet define the category that follows.
The forward portrait requires no forecast, because the base already contains it. Taste for the brand forms in the teenage years on the household's card and arrives on her own card at 18 to 24, the fastest-growing band. The core decade sits in the only age band whose womenswear spending is growing, and the demographic currents beneath it run in the brand's favor. The top of the arc compounds on its own. Five years from now the base looks like it does today, each stage one address further along.
The company describes "many different groups of clients." The panel shows one specific customer, at several stages of one life, holding a specific closet. The woman described above does not shop an aisle. She assembles that closet, a specific set of brands, at specific price tiers, in specific places. The category Aritzia actually competes in is not the one it is ranked in. It is the contents of her closet.
Category & Climate
The 29 brands in her closet define the category, and every macro force shaping it, from Gen Z's mall habit to Sun Belt migration, is running Aritzia's way.
The category, defined by her closet
How 29 brands were admitted to the Closet category on customer similarity, measured cross-shopping, and assortment.
Aritzia's category is defined by where its customer shops and what is in her closet. Aritzia's customer does not shop a single aisle in the apparel industry; she assembles a closet from a particular set of brands. Brands in this category were tested, not assumed: a brand joins only if its own sales base resembles Aritzia's across wealth, age, and neighborhood type by a wide margin over the broader market, if Aritzia's customers measurably spend there, and if it sells what she wears. Twenty-nine brands meet these requirements. Together they form the Closet category.
EXHIBIT 15 — Twenty-nine brands meet the Closet-category test; twenty-two of them also stand where she shops
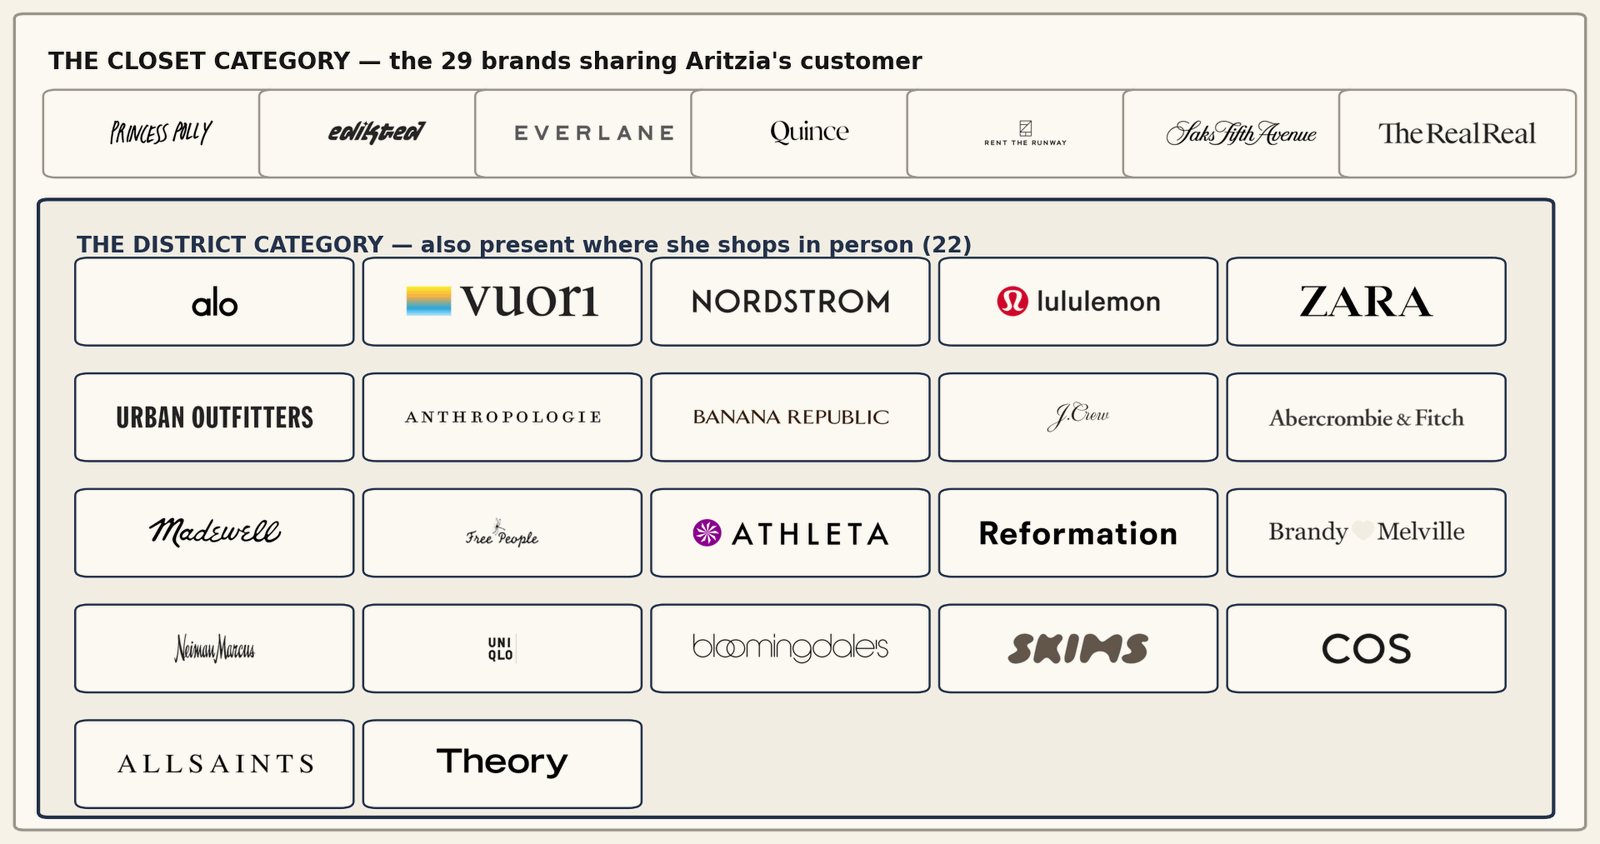
The District category
The District category is the subset of the Closet category that is also present where she shops in person: 22 brands with locations within two miles of Aritzia's US boutiques, with a further distinction for brands inside half a mile, the same street or retail center. Alo is the most co-located brand measured, within two miles of 84% of Aritzia's boutiques and inside the half-mile ring at 78% of them. The other large members, Vuori, Nordstrom, Lululemon, and Zara among them, cover half to three quarters of Aritzia's locations, and the brands with the smallest store networks make the same choice at their own scale: COS, AllSaints, and Theory's small number of stores are found at nearly all of Aritzia's locations.
The Closet category
Seven Closet-category members sit outside the District category. Five sell only online or nearly so: Princess Polly, Edikted, Everlane, Quince, and Rent the Runway. Saks, after its store closures, concentrates in Florida resort markets that are no longer where Aritzia is, and The RealReal's consignment shops split between Aritzia's districts and old-money streets Aritzia does not serve.
EXHIBIT 16 — Most category members stand within a short walk of the Aritzia SoHo flagship
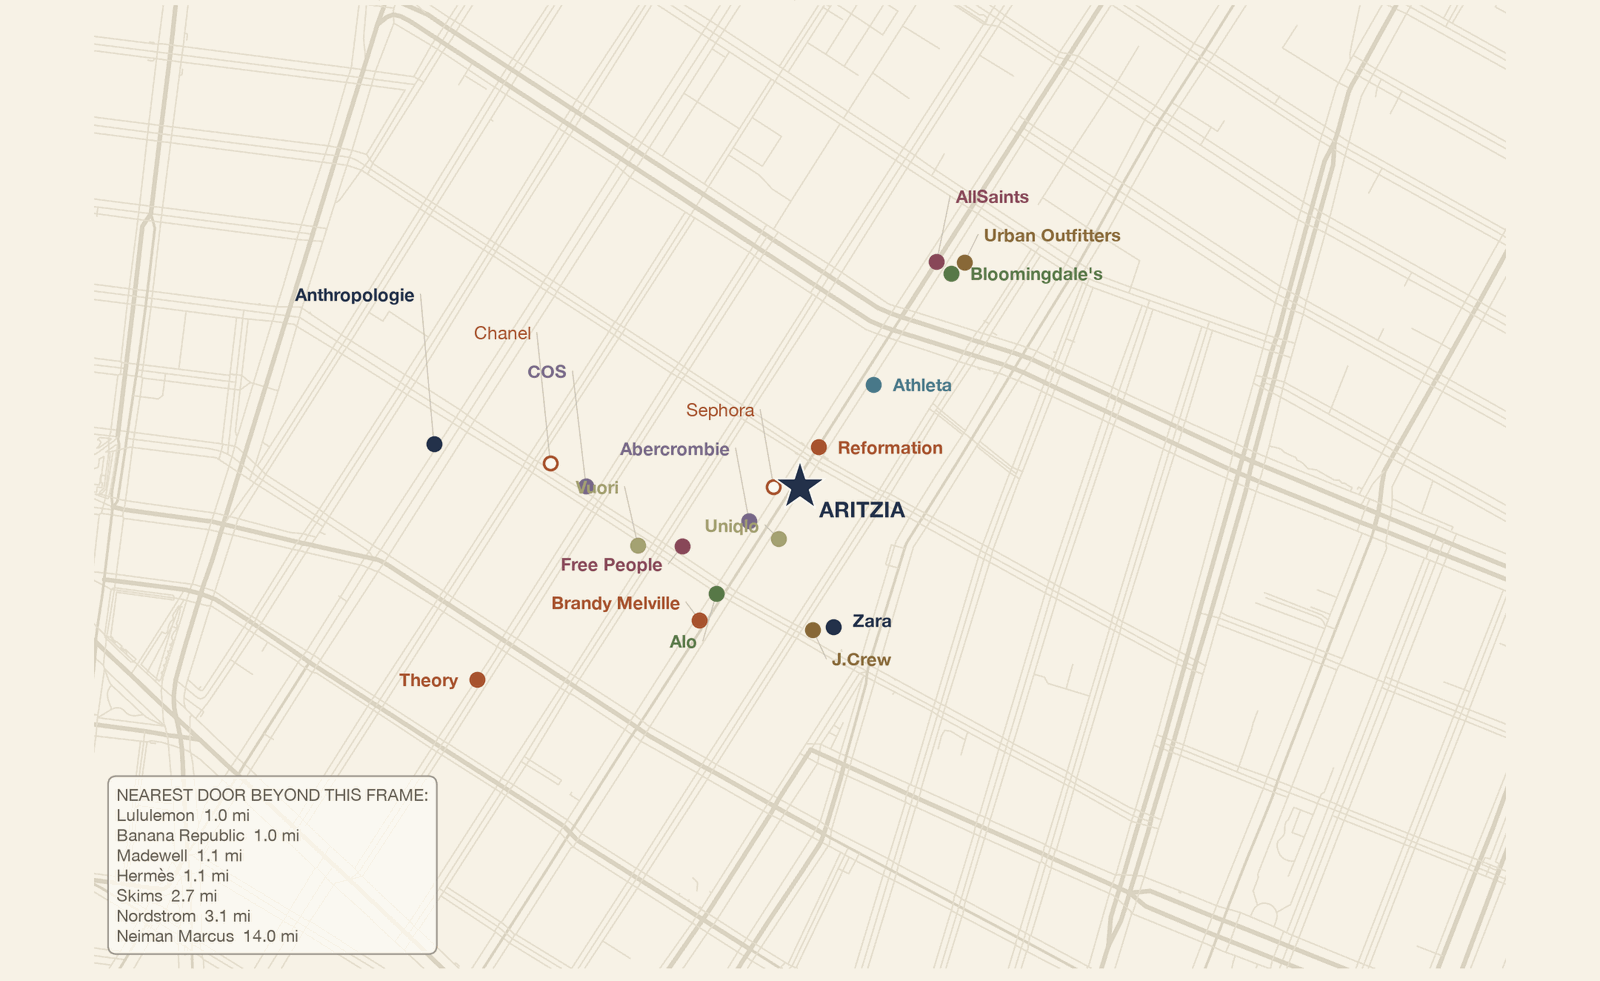
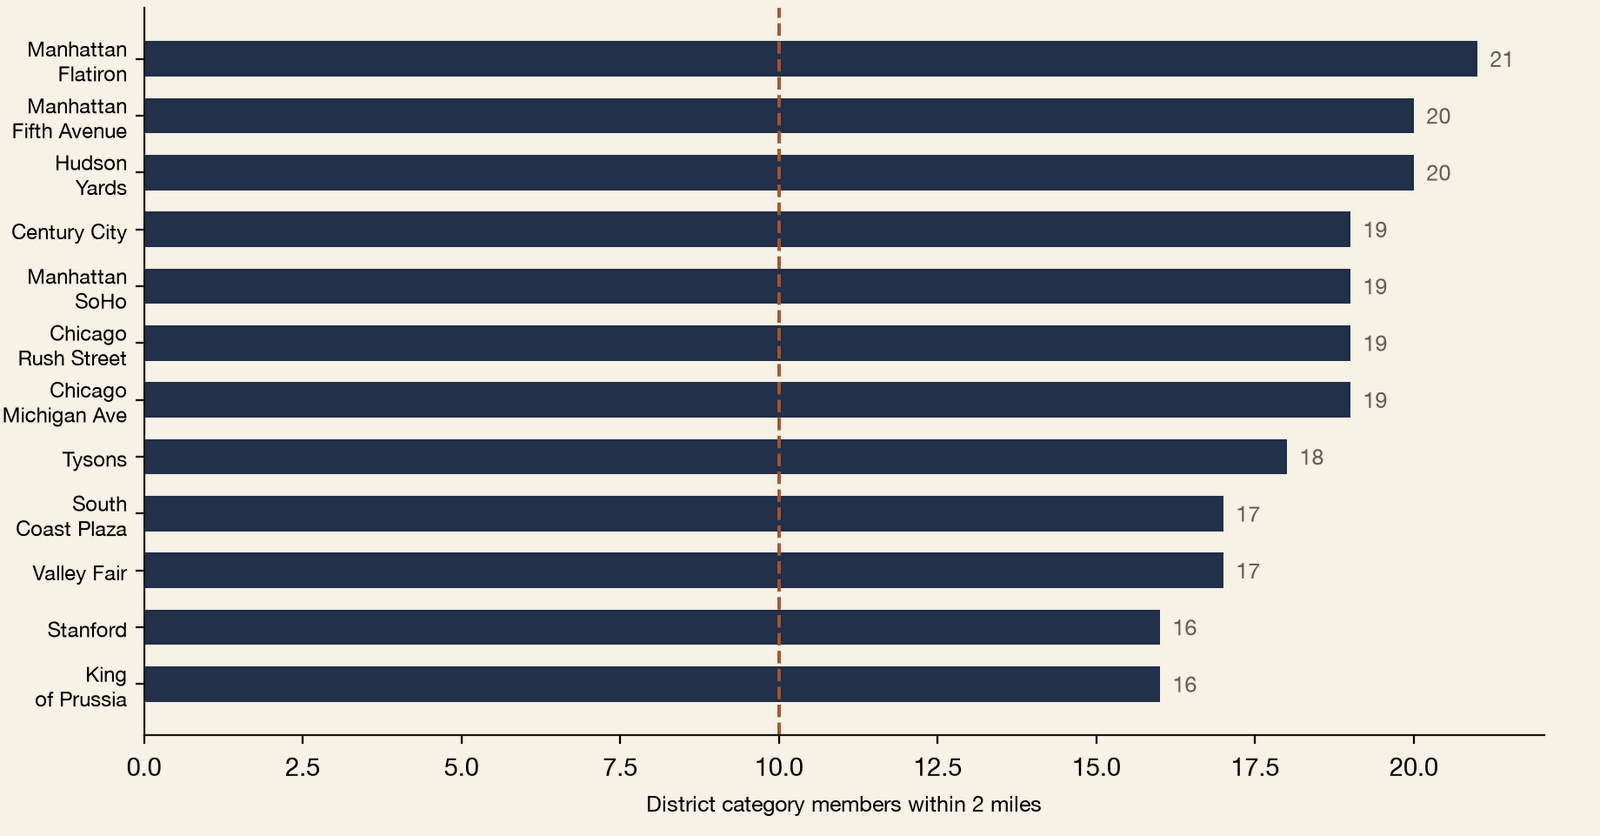
EXHIBIT 17 — At the median Aritzia location, ten category members stand within two miles
The comparison
Where Aritzia's share came from, how fast it grows against each member, and where its $169 ticket sits on the category's price ladder.
The Closet category's members book combined revenues of roughly $60 billion against Aritzia's US business of about US$1.8 billion, and the share is moving within that pool. Breaking down the shift, Aritzia's gain came from department stores, with Saks, Neiman Marcus, and Nordstrom giving up the most ground, and it is the largest gain of any women's-focused member (brands with more than 70% of sales to women).
The growth distribution makes the same point member by member. Ranked on the trailing three months, Aritzia grows near 70% a year while the median member grows in the single digits, the category's combined spend has gone roughly flat, and the bottom of the table is shrinking outright. The women's-core members sit through the middle of the table, which proves the growth is not a general women's-shopping trend that Aritzia happens to ride.
Average ticket shows what each brand's customer pays per visit. Brandy Melville sits at the bottom due to its Gen-Z shopper base's limited income. Aritzia's $169 sits near the middle of the category, which tops out at Reformation just under $300. Above that the new-goods ladder stops. No member sells new merchandise at an average basket between roughly $300 and Chanel's $1,104, and the single member trading in that space is The RealReal, at a $634 average basket, selling the luxury brands' goods as luxury resale. Aritzia's basket sits one step below the category's ceiling, collecting the demand the luxury tier prices out.
EXHIBIT 18 — Aritzia's share gain came out of the department stores
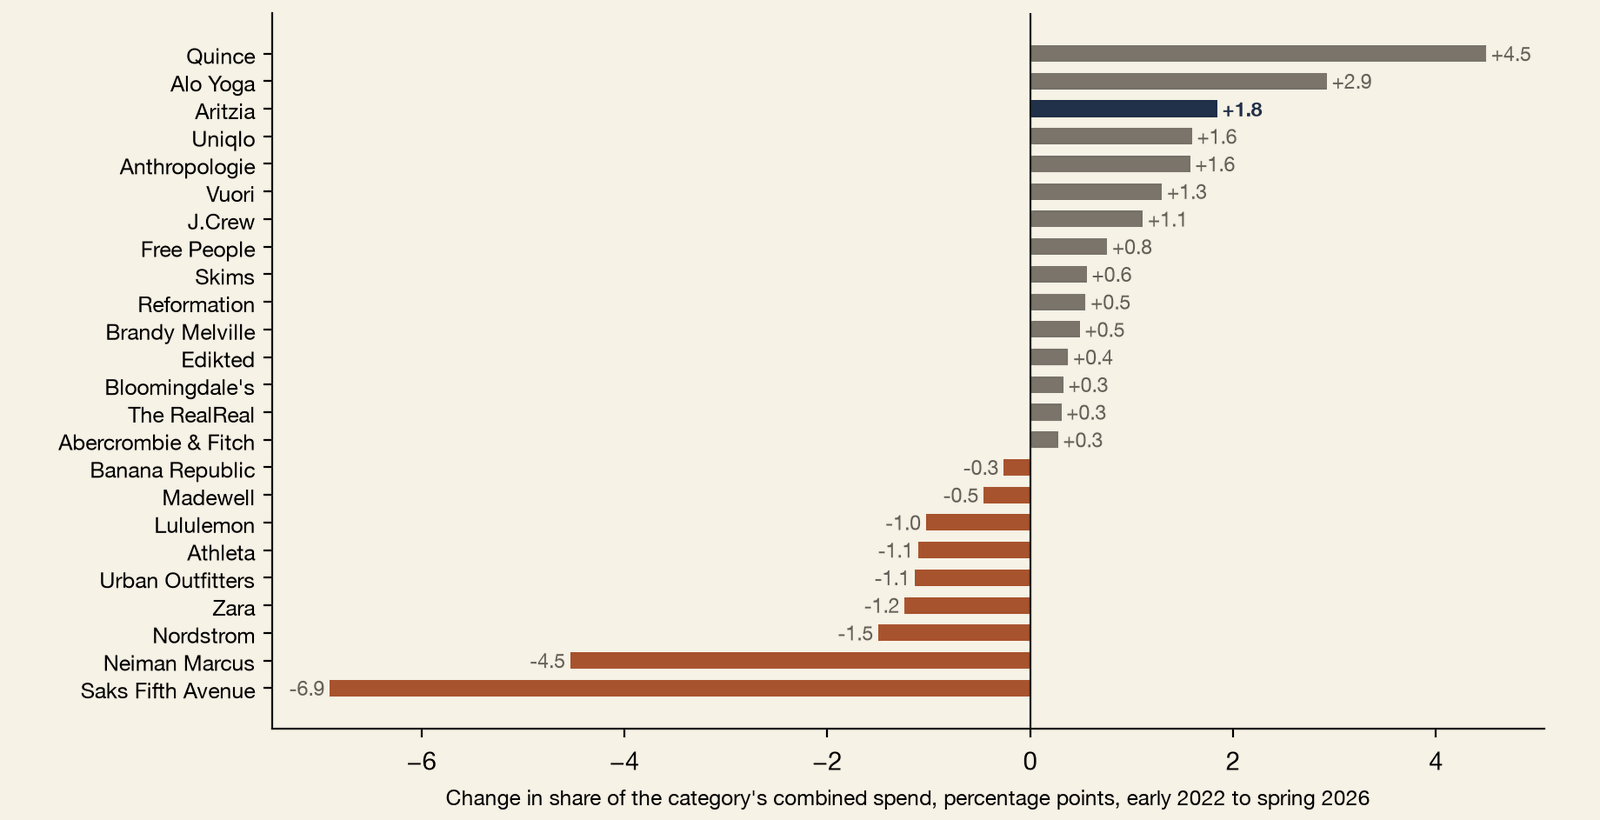
EXHIBIT 19 — Aritzia grows near 70% while the median category member grows in single digits
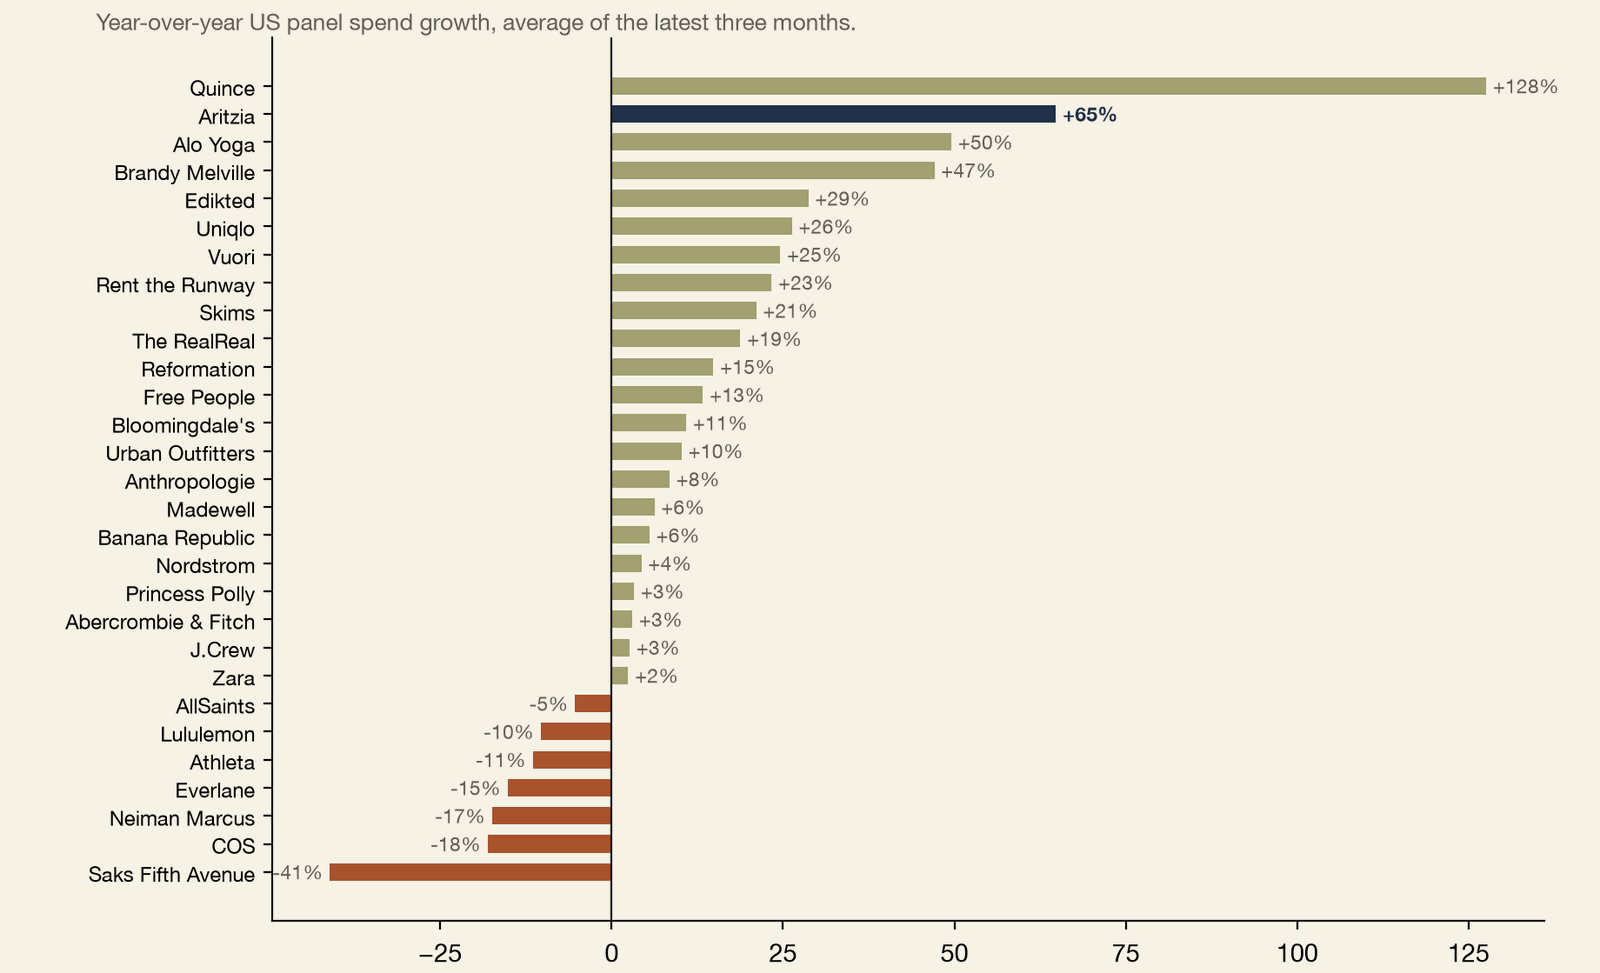
EXHIBIT 20 — New goods stop near $300 and luxury starts at $1,104; only resale trades between
Where the online dollar went
Aritzia's online spend grew 102% in a category growing 2%, as multi-brand luxury e-commerce collapsed and commerce moved to the feed.
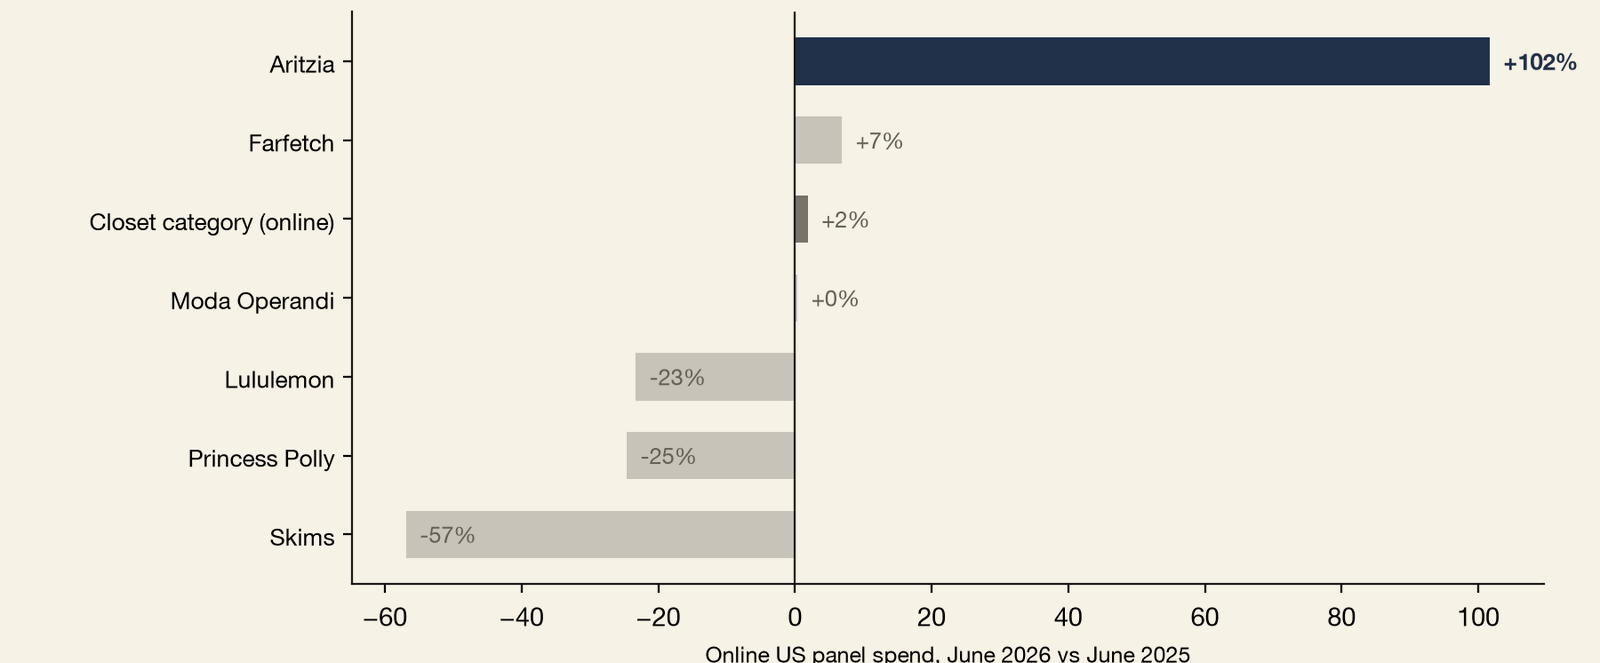
Multi-brand luxury e-commerce contracted through bankruptcies, distressed sales, and shutdowns across the sector. In the panel, spend at the surviving sites sits flat to below its 2022 level. Commerce went social instead, toward feeds, video, and peer-to-peer discovery, and away from the multi-brand storefront. Within the category, the online dollar is concentrating the same way the store dollar is. Aritzia's online spend grew 102% over the trailing year while the category's online spend grew 2%, and the members most concentrated online, Princess Polly and Skims, shrank outright.
EXHIBIT 21 — Aritzia's online spend grew 102% against the category's 2%
Retail brands broadly are responding the same way, pulling away from third-party channels and building their own direct-to-consumer presence; every brand in the category has its own app now. Aritzia's digital business stands out within that crowd. Digital delivered 35% of fiscal 2026 revenue, rising to 41% in the holiday quarter, in line with the category's leaders; analysts put Lululemon near 45%. What stands out is the growth: digital revenue rose 55.5% in FQ1 2027 (March–May 2026), faster than the stores that feed it. The app, launched in October 2025 for iPhone only, is modeled directly on the social feeds its customer frequents, an Instagram-style layout with the products shoppable from inside the imagery. Its App Store ratings accumulated faster in nine months than most peer brand apps manage in years, at a 4.9 average.
The climate
Gen Z's store habit, a supply-starved premium property market, Sun Belt migration, women's earnings, and a taste shift toward tailoring.
Several macroeconomic forces are shaping overall retail. All of them are currently running in the category's favor, and specifically Aritzia's.
The youngest paying cohort turned out to be the store-loving one: 97% of Gen Z shops brick and mortar, six in ten report visiting malls to socialize, and shoppers 18 to 24 complete more of their purchases in stores than shoppers a decade older. The generation is everywhere; its shopping is not. Rather than spreading uniformly across retail, its store traffic and taste-making concentrate in the wealthy Class A venues, the same short list of malls and corridors where this category stands. The Customers analysis showed Aritzia's 18-to-24 revenue share nearly doubling in four years.
Supply has moved the opposite direction. While demand for the best retail recovered, construction stopped. National retail availability sits at 4.9% with new construction at record lows, held down by build costs, materials up roughly 37% since 2020 with construction labor persistently short. The premium end is tighter still. Manhattan's prime retail corridors reached 13.7% availability in the first quarter of 2026, the lowest since the data series began in 2017, with fewer than twenty marketed spaces left across SoHo and Madison Avenue and SoHo asking rents up 24% in a year. Fixed supply converts tenancy into a rationed good, and the ration is being reallocated. As older mid-market tenants surrender space in the best centers, the names taking it are this category's members.
The map itself is growing. The Sun Belt's income base has permanently re-rated, Texas adding 2.6 million people since 2020 and Florida 1.9 million, with Florida drawing over $20 billion of adjusted gross income in a single tax year. Premium retail is now being built where that income settled. The category's members are opening their first doors in Birmingham, New Orleans, and secondary Texas metros in 2025 and 2026, Aritzia's fiscal 2027 slate among them. None of it has come at the old map's expense. Manhattan set its occupancy records over the same period the Southern build-out happened; the old markets did not shrink to feed the new ones. That is expansion, not migration.
EXHIBIT 22 — Aritzia's Southern share climbed from 18.5% to 28.6%, the steepest move in the group
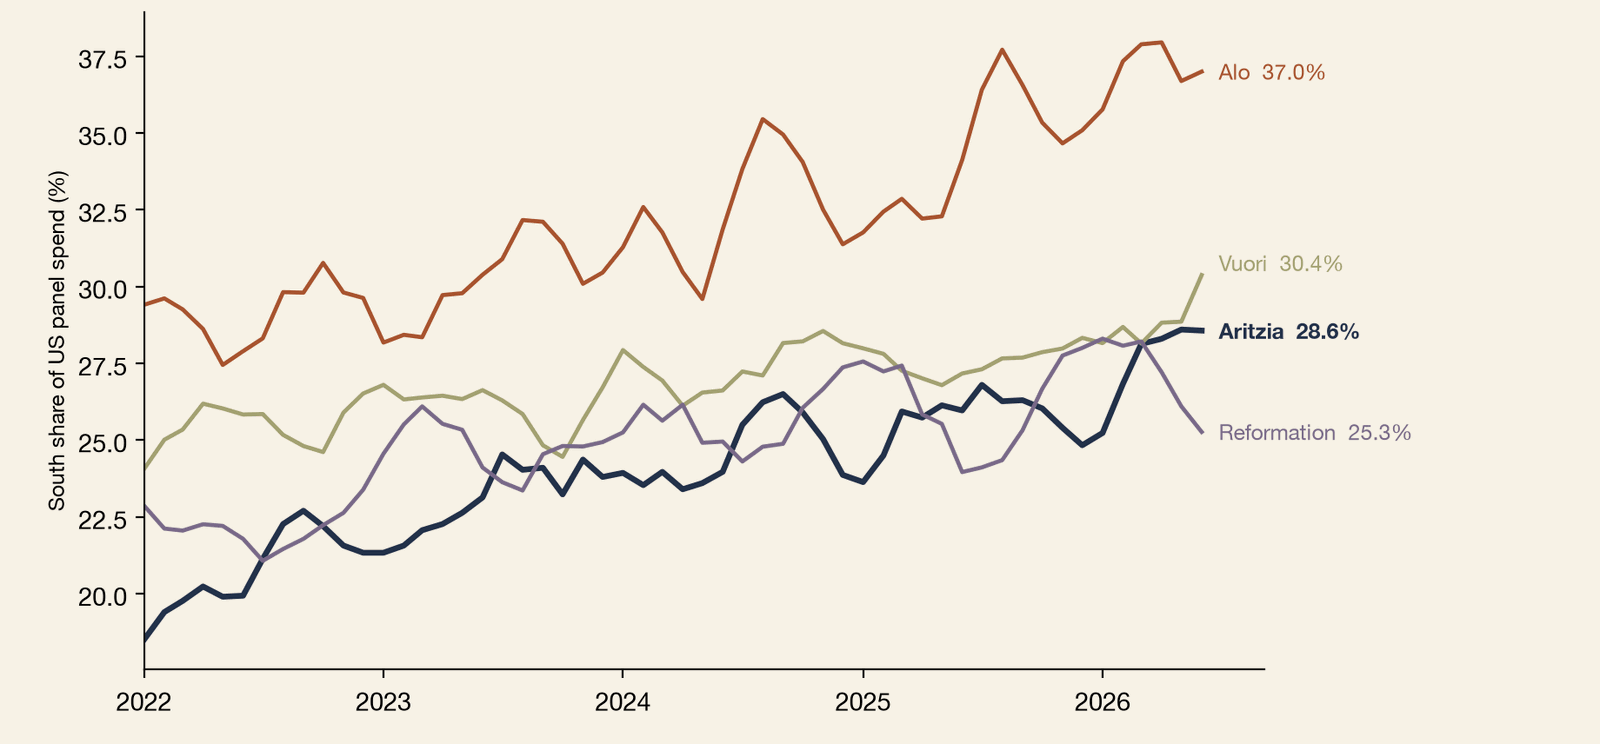
Among the members opening Southern stores, the South's share of each brand's spend is climbing. Alo has reached 37%, Vuori 30%, Reformation 25%, and Aritzia has risen from 18.5% to 28.6% in four years, the largest climb of the group, with the fiscal 2027 store slate aimed at exactly these metros.
Women are the backbone of clothing retail. Even the category members carrying full men's lines sell mostly to women, Nordstrom at 62% and Abercrombie & Fitch at 71%. The customers funding this category are also earning more than any previous generation of women. Young women now earn about 93 cents on the male dollar nationally, the narrowest gap on record, and have reached full wage parity in the largest metros, including New York and Washington. Women 25 to 34 hold bachelor's degrees at 47% against 37% for men their age. Prime-age women's labor-force participation has been setting records since 2023. The median age at first marriage, now 28.6, extends the high-discretion single-professional years far beyond any prior generation's.
Lastly, cultural aesthetic preferences have shifted. GLP-1 adoption has reached 11% of US adults, up from 3% in 2024, roughly one in eight American women, with nearly a quarter of households including a user, and adoption is heaviest in the insured, higher-income households this category sells to. Taste has moved with it, toward fit, tailoring, and a dressed-up polish, a shift the category's own companies describe in their earnings language about evolving client preferences. Aritzia's assortment sits squarely on the receiving side. It never built a plus sized line, its sizing has always ended where the straight-size industry ends, and its tailoring franchises sell the silhouette the moment rewards.
The limiting factor*
Tariffs and the end of de minimis are the one force taxing the whole category, and the policy behind them is still moving.
The one force that taxes the whole category is trade policy. The end of de minimis in August 2025 abolished the duty-free lane that built the value flank's price advantage. Broad tariffs raised the cost floor of an industry that manufactures almost nothing domestically, and the panel shows the marketplaces' US momentum breaking within months of the change. For the premium tier the same policies arrived as a margin tax. Aritzia has quantified its bill. Tariffs and the de minimis change cost 260 basis points of EBITDA margin in fiscal 2026 and another 190 basis points of gross margin in FQ1 2027, and the company posted record margins in both periods anyway. Guidance for fiscal 2027 assumes 10% US tariffs. Refund claims on duties paid under the invalidated IEEPA authority were filed in May 2026 and sit unrecognized in the financials.
The tariff regime itself is at an inflection. The courts struck down the IEEPA tariffs in February 2026. The 10% baseline was then re-imposed under Section 122 of the Trade Act, an authority capped by statute at 150 days. That clock runs out July 23, 2026, and extending the baseline beyond it requires Congress. Separately, on July 20 the administration imposed 50% tariffs on a list of Canadian goods under Section 338 of the Tariff Act of 1930, a provision unused for nearly a century. The stated grievances include the provincial liquor-board removals of American products. Apparel is not on the list. Aritzia's US-bound goods are made largely in Asia and imported directly into its US fulfillment network, not Canadian-origin merchandise, so the direct exposure is negligible. What the action signals matters more. Tariff policy now moves across legal authorities as each one hits its limits. A widening US-Canada spiral could eventually touch goods that matter, including Reigning Champ's Canadian-made product. And the cross-border boycott has become explicit state policy, a dynamic that lifts Aritzia's Canadian comps while its nationality goes unnoticed by the US customer.
Competition
Aritzia is taking wallet share from 25 of 27 measurable rivals across department stores, athleisure, workwear, denim, and fast fashion, while holding list prices below apparel inflation.
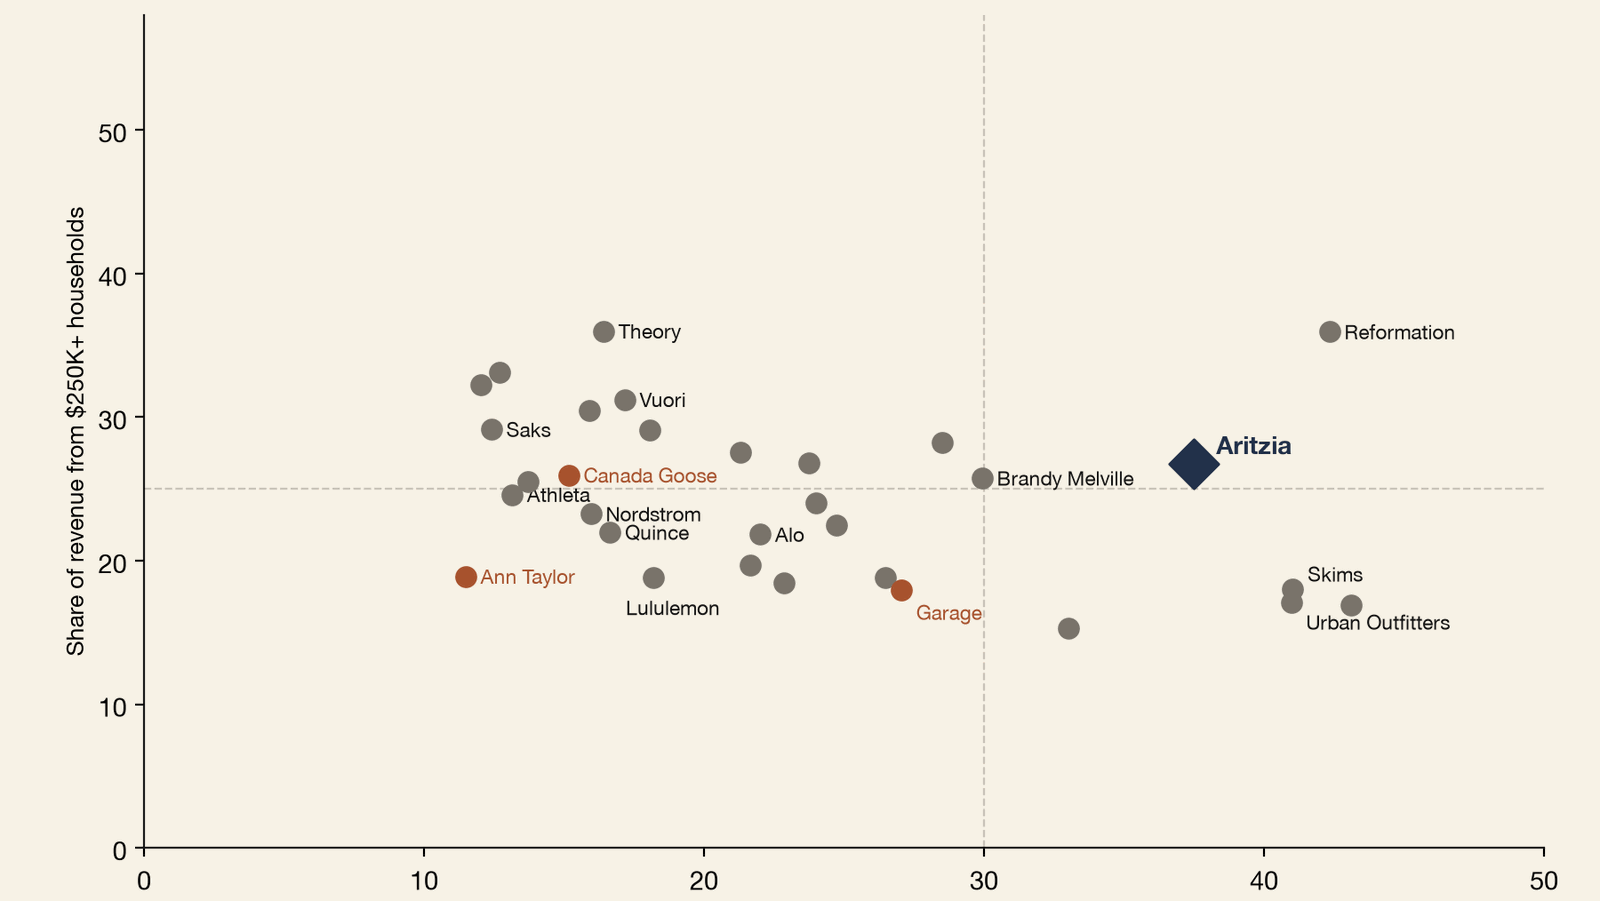
Aritzia has one of the strongest customer positions in the Closet category. Reformation is the only member that appears to do better on the category's two defining metrics, revenue from young customers and revenue from wealthy households. Underneath those two numbers Aritzia holds the stronger base. It takes more of its revenue from customers aged 18 to 24, the signal of long-term growth, and it pulls less of its revenue from households above $250,000 and $500,000, the mark of a fuller and healthier customer mix. The athleisure brands hold the wealth without the youth. The mall and teen brands hold the youth without the wealth. Where a brand sits on this map is where it competes from. Aritzia's structure and its sub-brands also allow it to compete with specialized brands outside its category.
EXHIBIT 23 — Aritzia is the only brand holding youth and wealth at once
Online competition
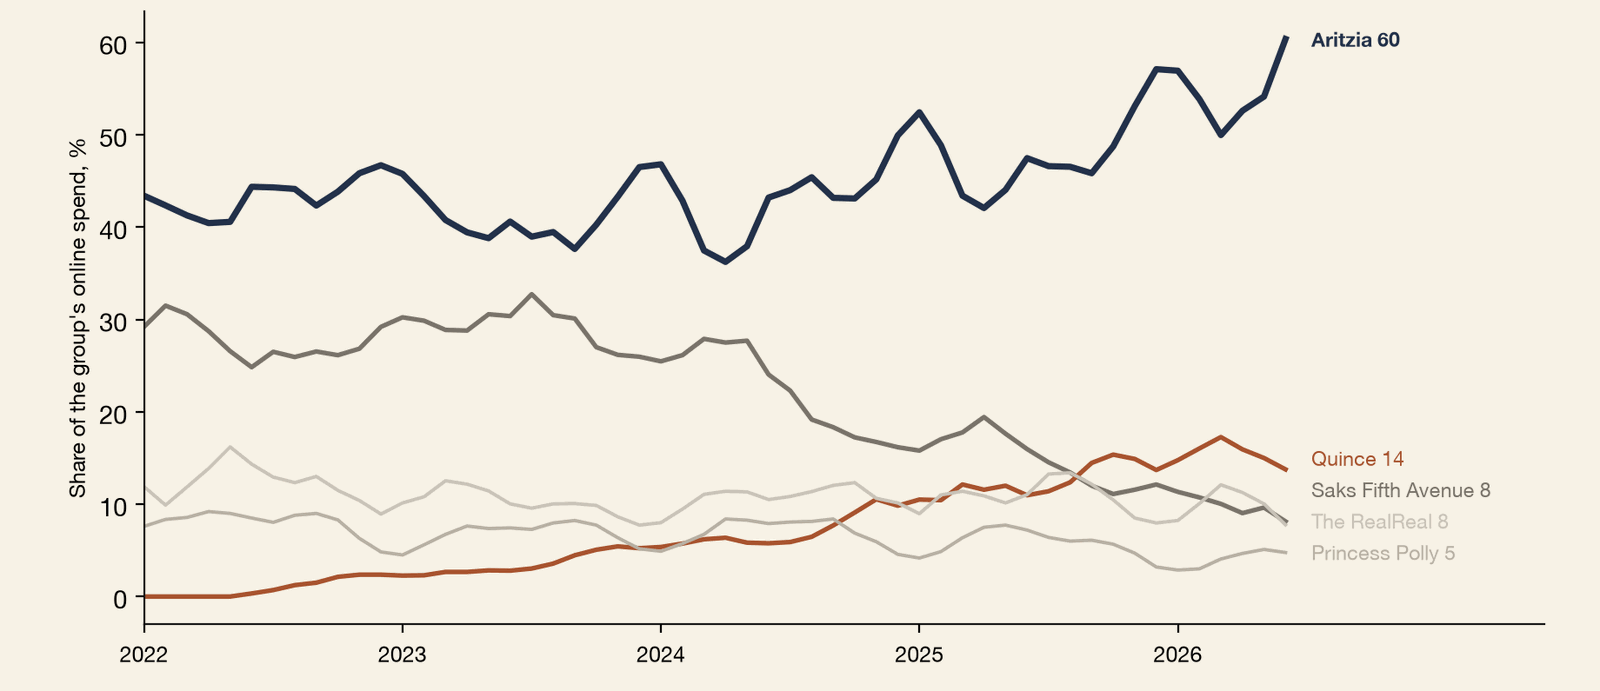
Aritzia's share of the online-only group's wallet rose from 43% to 60%; Quince is the only member gaining.
The Closet category's online wing is seven members. Five never built stores, and two, Saks and The RealReal, arrived online by retreat. Among Aritzia's tracked customers, the group's online wallet has consolidated into Aritzia, from 43% of the group's combined online spend in early 2022 to 60% this spring, and 67% in June alone, while Saks fell from 29% to 8%.
Quince is the exception, the only member gaining, and it now takes 14% of the group's online spend. Its median dress lists at $70 against the $148 median of Aritzia's labels. Quince is an apparel company that also sells almost everything else, from coffee makers to wedding bands, and it markets itself in Aritzia's exact framing, everyday luxury for everyone. The breadth cuts both ways. It makes direct panel comparisons difficult, because Quince's apparel dollars cannot be cleanly separated from its housewares. And it leaves Quince running Aritzia's positioning without Aritzia's focus.
EXHIBIT 24 — Aritzia took the online wing's wallet from 43% to 60%
Location competition
Bigger boxes in the vacancies department stores leave, while the rest of the category builds too.
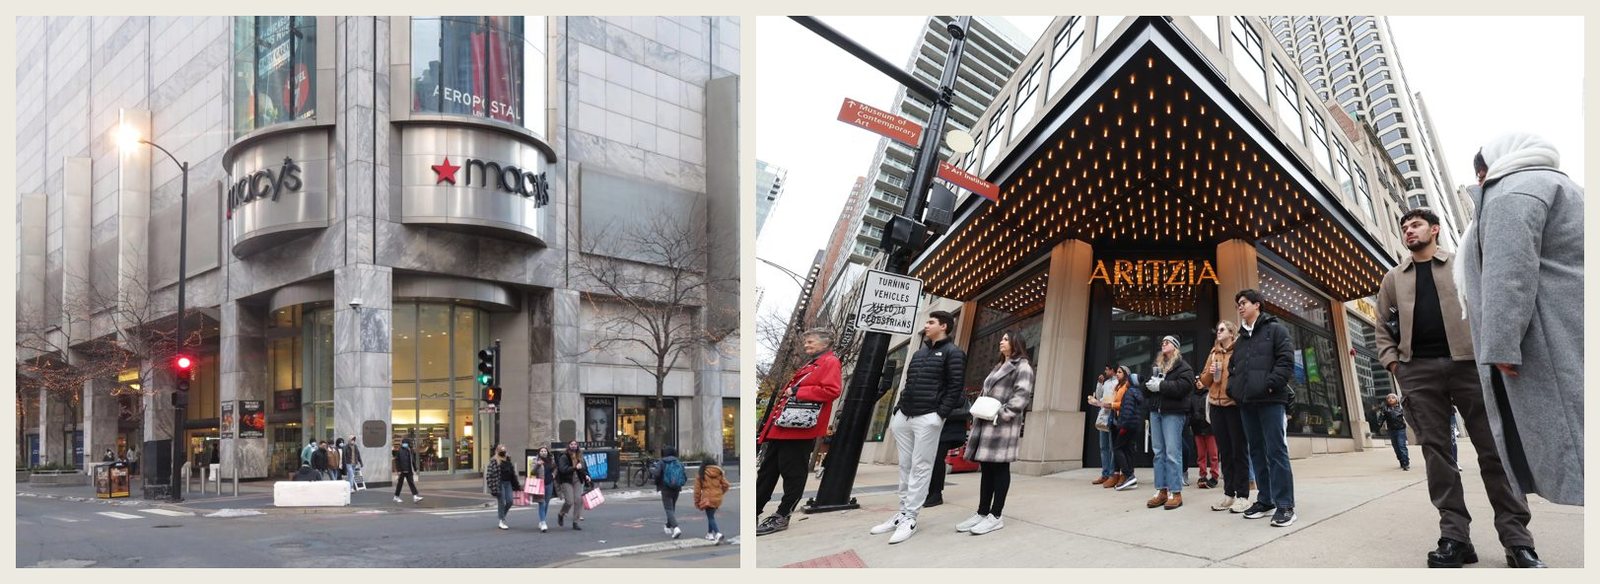
Aritzia's stores are getting bigger. The company's locations historically ran near 6,000 square feet, its new ones run past 10,000, and its newest run 25,000 to 40,000. Premium retail space is limited and expensive, and vacancies at that scale mostly appear where department stores leave. That is where Aritzia has been going. The Michigan Avenue corner that carried Macy's signage now carries Aritzia's. The 40,000 square foot Vancouver store planned for 2027 occupies a closed Nordstrom. The Fred Segal purchase in February 2026 came with the lease on the shuttered Melrose Avenue store.
The rest of the District category is building too. Urban Outfitters has announced 54 openings for 2026. Lululemon planned 10 to 15 Americas stores for 2025. Zara has three US openings planned for 2026. Aritzia opened 14 boutiques in fiscal 2026 and has announced at least 12 more. The newest members are expanding fastest of all. Alo's own store list shows 126 US locations, and Vuori has passed its stated target of 100 US stores. The traffic runs the other way at the far end. J.Crew operates about 120 US stores against 181 in 2020, and Saks's remaining stores concentrate in Florida. The category's brands are spending to be where she shops, and Aritzia is buying the biggest spaces on the list.
The exclusive brands
Each in-house label carries its own name, occasion, and price band, and each stands on its own against a rival.
Aritzia calls itself a design house, home to "an extensive portfolio of exclusive brands for every function and individual aesthetic." Each label carries its own name, aesthetic, occasion, and price band. Each is also distinct enough, and popular enough, to hold its own following and stand against rival brands without the Aritzia name attached.
EXHIBIT 25 — The in-house labels divide her life by age and occasion
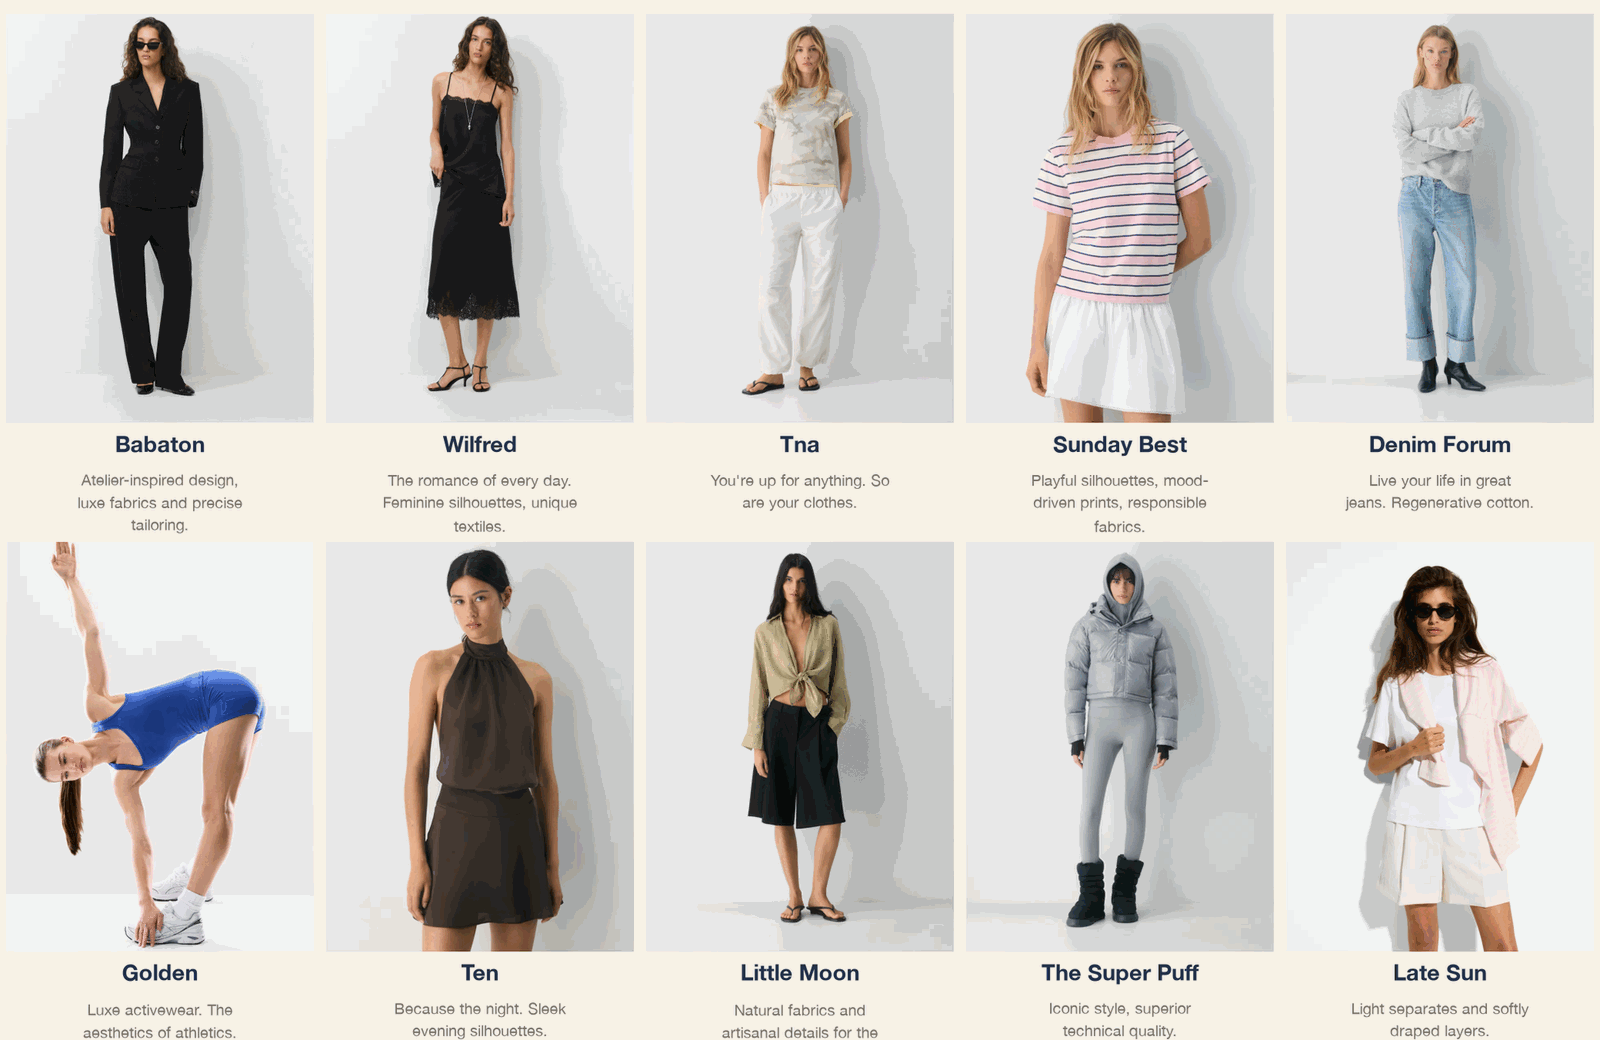
The labels divide her life by age and occasion. Tna and Sunday Best are targeted at gen-z. Wilfred and Babaton are targeted at women in the professional labor force. Golden covers athleisure and Ten covers evening excursions and events. This coverage allows Aritzia to appear as a marketplace of distinct brands that span a wide range of aesthetics and occasions, while each belongs to Aritzia. Competitors that target the younger audience struggle to retain customers as they age out of their clothing lines. Aritzia's model solves this problem. Every age group carries balanced weight, and instead of aging out of the brand, customers age out of one sub-brand and into another. Aritzia launches these specialized labels in response to changing consumer trends. Denim Forum arrived in 2018 as vintage-inspired denim returned. Golden's 2024 release capitalizes on athleisure demand as pilates grew in popularity among Aritzia's customers.
Competing outside the category
Babaton against Ann Taylor, the Super Puff against Canada Goose, Tna against Garage, Denim Forum against premium denim.
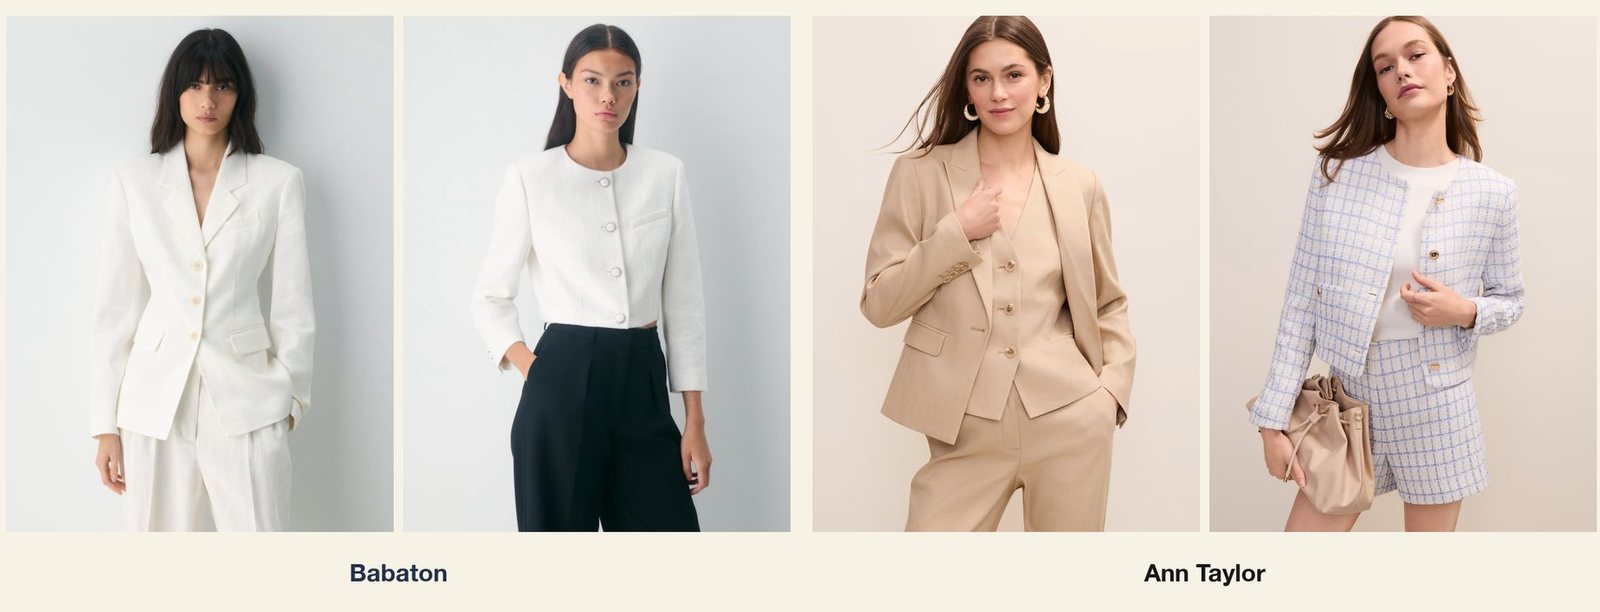
Ann Taylor falls outside Aritzia's category. Its customer base is older, and it markets directly to professional white-collar women with a workwear closet. Aritzia competes with it for those customers anyway, through Babaton. The label carries the tailoring, the fabrics, and the office wardrobe of a workwear specialist inside a store that is not one. Babaton allows Aritzia to compete with a specialty brand without becoming one, and the wallet between the two has moved 4 points toward Aritzia since early 2022.
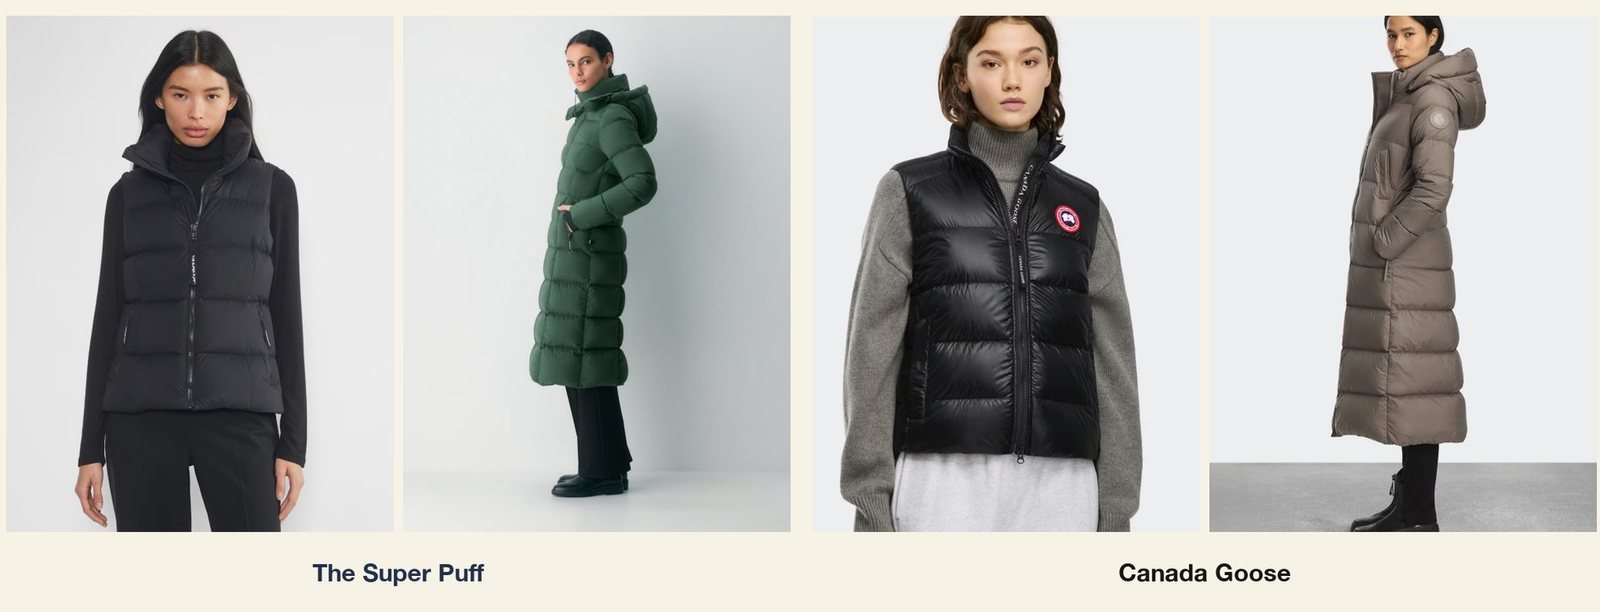
Canada Goose sits outside the category the same way. Its customer base is one of the closest matches to Aritzia's of any brand tested. The Super Puff answers it with the Everyday Luxury strategy applied to outerwear. The SuperSnug vest lists at $225 against Canada Goose's Cypress Vest at $595. The SuperSnug Long lists at $350 against long puffers running $1,000 to $2,000. The full catalogs hold the same gap. Super Puff garments run $178 to $450 with a $278 average, while Canada Goose's women's outerwear starts at $595 and climbs past $1,700. Both lines use 700-plus fill responsibly sourced down, and both are rated for roughly the same cold.
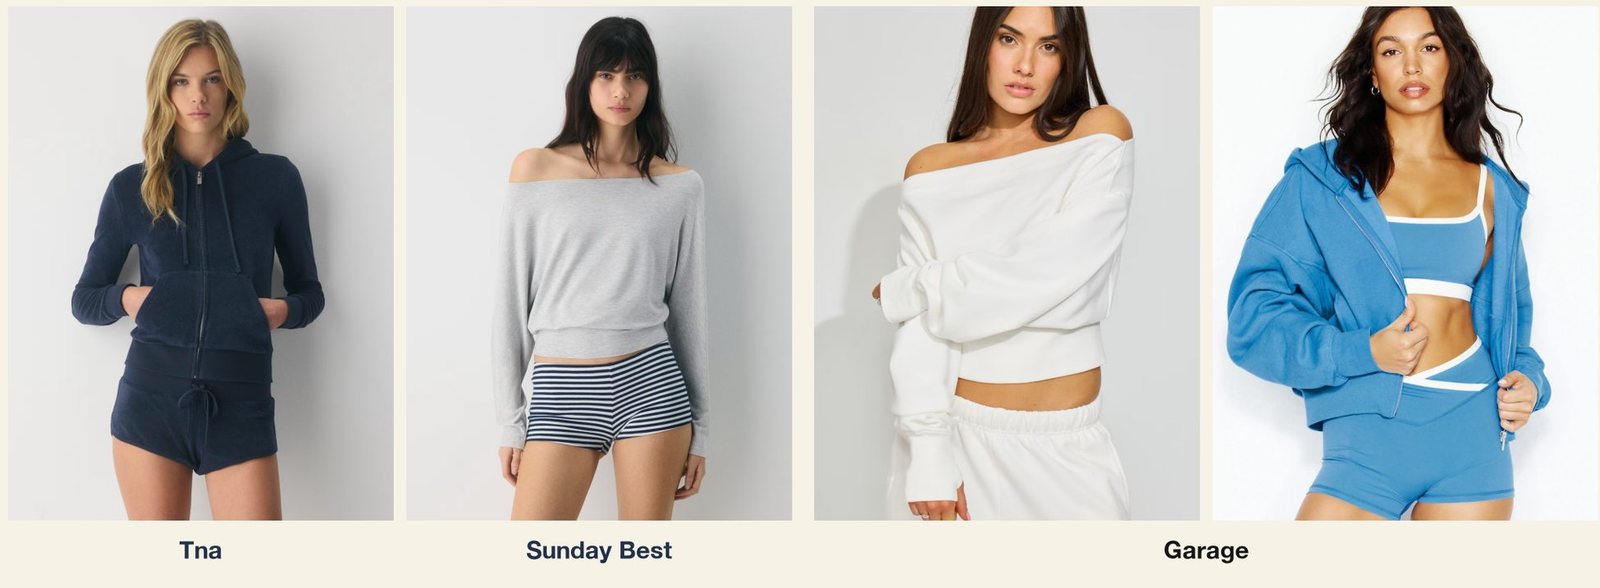
Garage is a teen and young-adult store. Tna competes with it at a similar price point, in the same styles the teenager already wants, and it lets Aritzia court the gen-z customer early without moving the rest of the company toward her. The position this creates is rare. Eleven other members draw as much of their revenue from households above $250,000 as Aritzia does. None of them takes even 8% of its revenue from customers aged 18 to 24. Aritzia takes 11%, and Tna and Sunday Best are why.
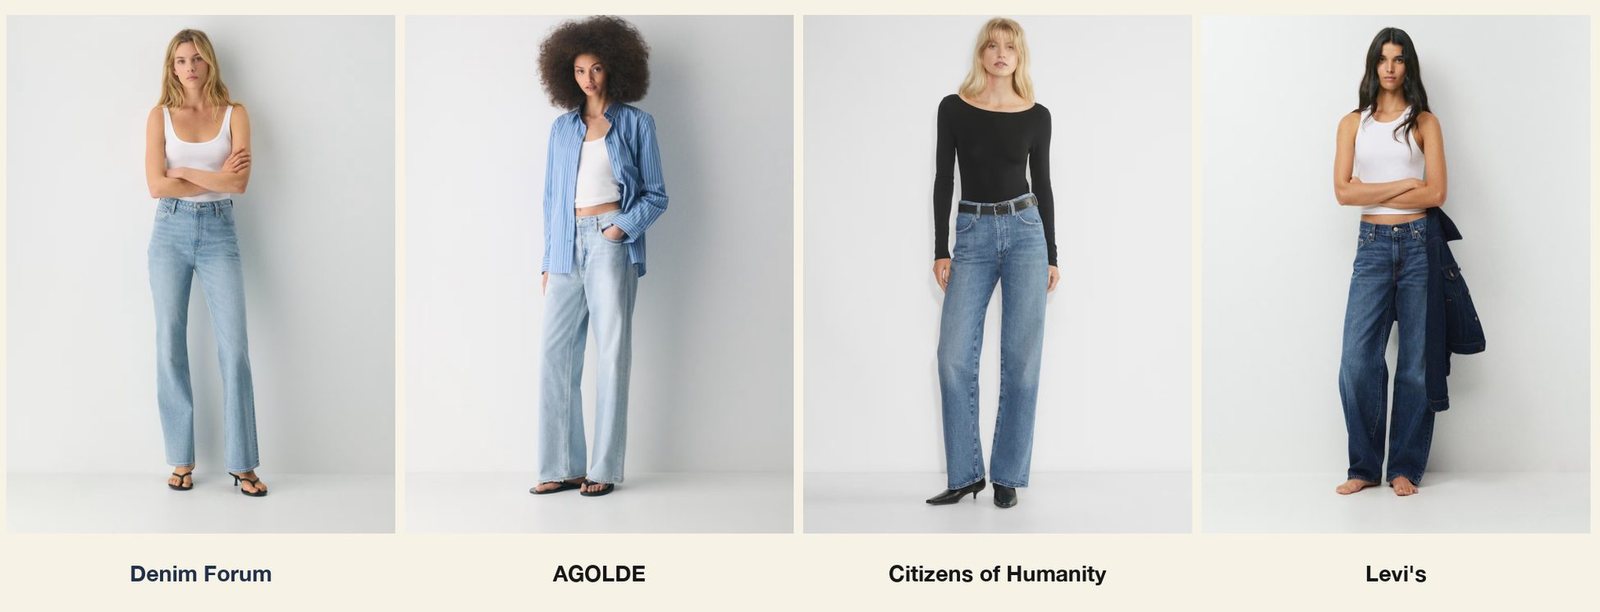
Denim Forum conducts the comparison in-store. Aritzia stocks 13 outside brands, and three of them are jean labels. On Aritzia's own racks, AGOLDE averages $230 at full price, Citizens of Humanity averages $250, and Levi's averages $95. Denim Forum hangs beside them, averaging $100, the premium denim silhouette at a competitive price.
Reformation
The closest customer match in the category, one price tier up and growing at a fraction of Aritzia's rate.
Reformation is the one member whose customer base mirrors Aritzia's two defining coordinates, and among the category's store brands it is the closest customer match measured. It reaches that customer at prices a full tier above Aritzia's.
EXHIBIT 26 — Reformation dresses the same woman one price tier up
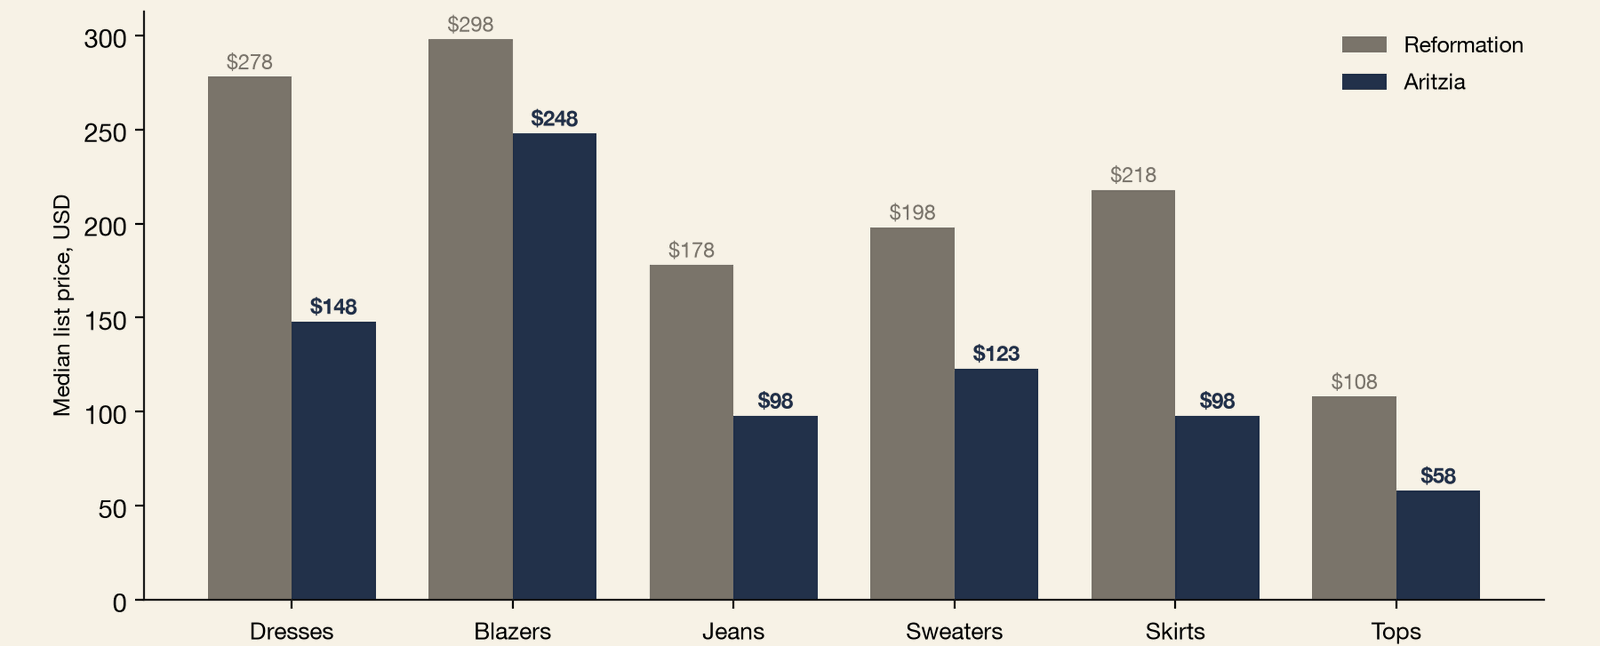
Aritzia is beating it. Reformation's growth over the trailing year ran between 7% and 22% while Aritzia's ran between 60% and 72%, and the spending split between the two brands has held near three-quarters in Aritzia's favor for four years. The difference is the price point. The two companies dress the same woman, and Aritzia does it for roughly $100 less per garment.
Athleisure
Among shared customers, Aritzia's share of the Lululemon pair wallet rose from 37% in early 2024 to 67% by spring 2026.
Lululemon is the category's largest brand rivalry. 47% of Aritzia's US customers bought at Lululemon over the trailing year. Under 5% of all US consumers in the panel did. It is also the rivalry moving fastest. The wallet series tracks a fixed group of Aritzia customers and splits their combined Aritzia and Lululemon spending between the two brands. Aritzia's share of that split was 43% in early 2022. It fell to 37% in early 2024, the bottom of the markdown cycle. It reached 67% by spring 2026 and is still climbing. In 2022 these customers spent more at Lululemon than at Aritzia. They now spend twice as much at Aritzia.
The transfer runs against a company in retreat. Analysts now argue Lululemon's Americas business is 25 to 60 percent larger than its sustainable base and describe a shrink-to-grow reset as the likely next chapter. Its stock trades near half its 52-week high. The taste climate is doing part of the work. GLP-1 adoption and the return of tailored dress moved demand from performance wear toward the silhouettes Aritzia's labels sell. Athleta cedes the same way, 11 points across the window, and it carries the extra weight of that shift. Its customer base is the oldest in the bloc, concentrated in the households adopting GLP-1s fastest, and the taste change that follows runs against athleisure first.
EXHIBIT 27 — Aritzia's share of the Lululemon pair wallet has risen since mid-2024
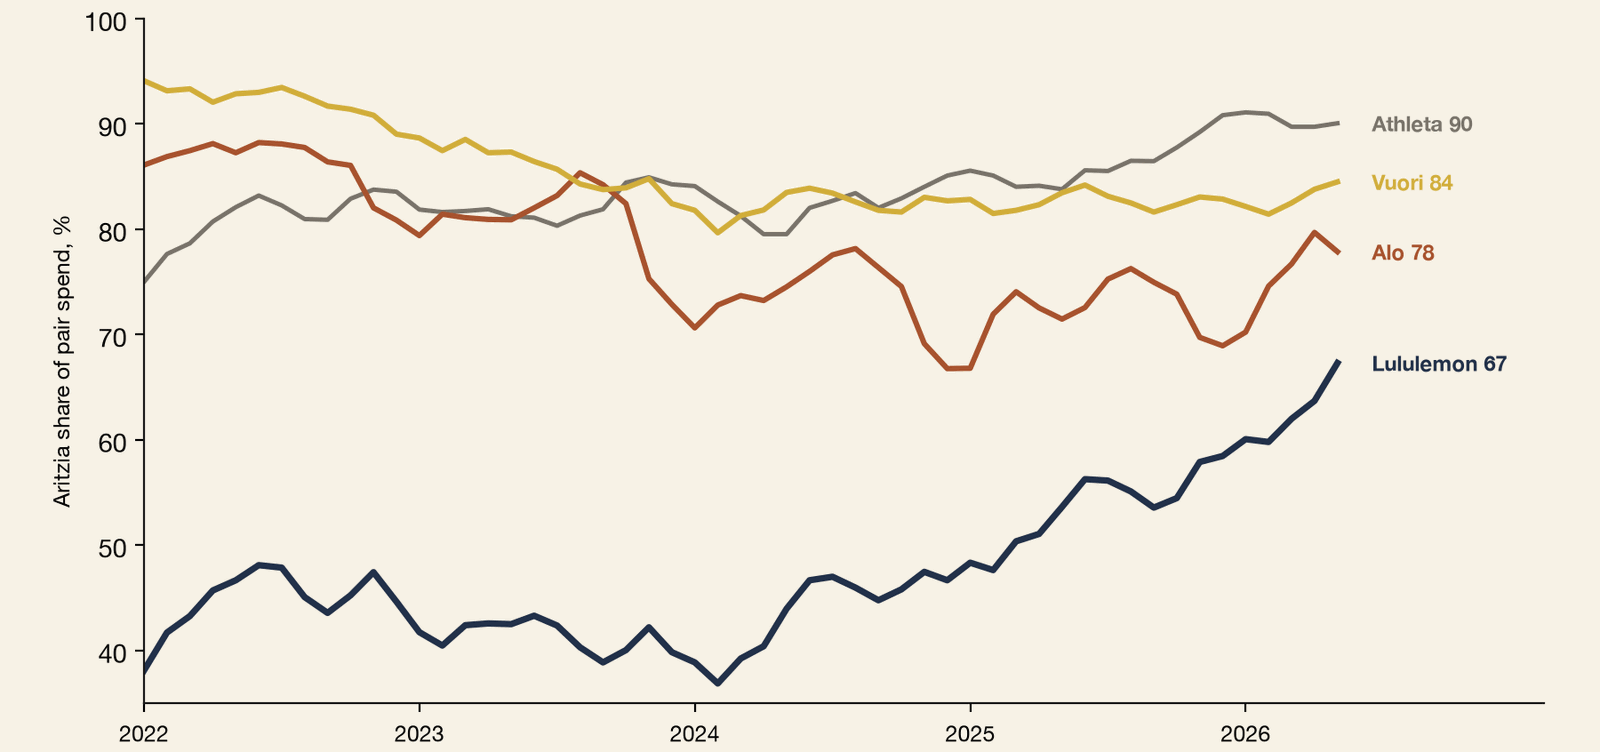
Alo and Vuori are the challengers on the same chart, and their gains came out of Lululemon's share of her wallet, not Aritzia's. The customers moving spending out of Lululemon sent part of it to Aritzia and part to the newer athleisure brands. Their advance also ended with the markdown cycle. Aritzia's share of the Alo pair bottomed at 67% in late 2024 and has recovered to 78%, and Vuori's line has been flat since early 2024. Both lean on 35 to 54 year-old households, while Aritzia's base spreads across every age band and replenishes from below.
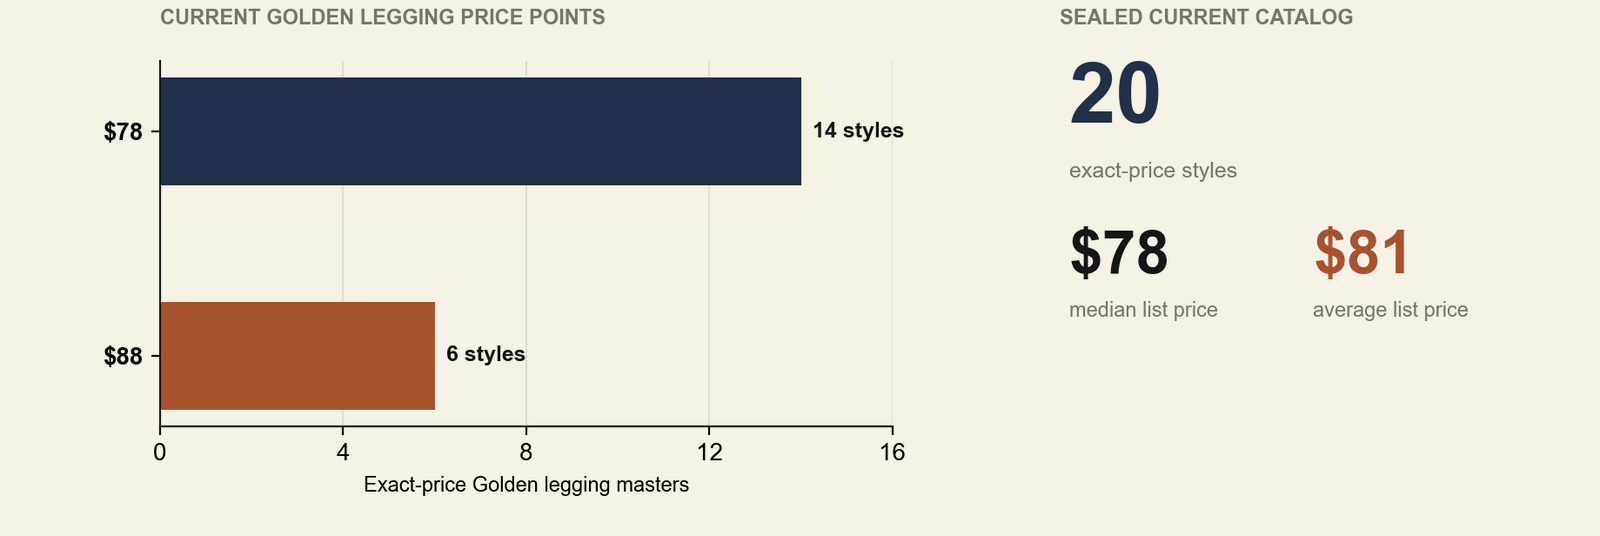
Golden, Aritzia's activewear label, is another example of the Everyday Luxury promise expressed inside the assortment. In the sealed August 24 current catalog, all 20 Golden legging masters with one exact regular list price sit at only two points: 14 at $78 and six at $88. The resulting $81 average describes Aritzia's own deliberately narrow activewear price ladder; it is not a peer-price comparison, although Aritzia's leggings are priced below that of its competitors.
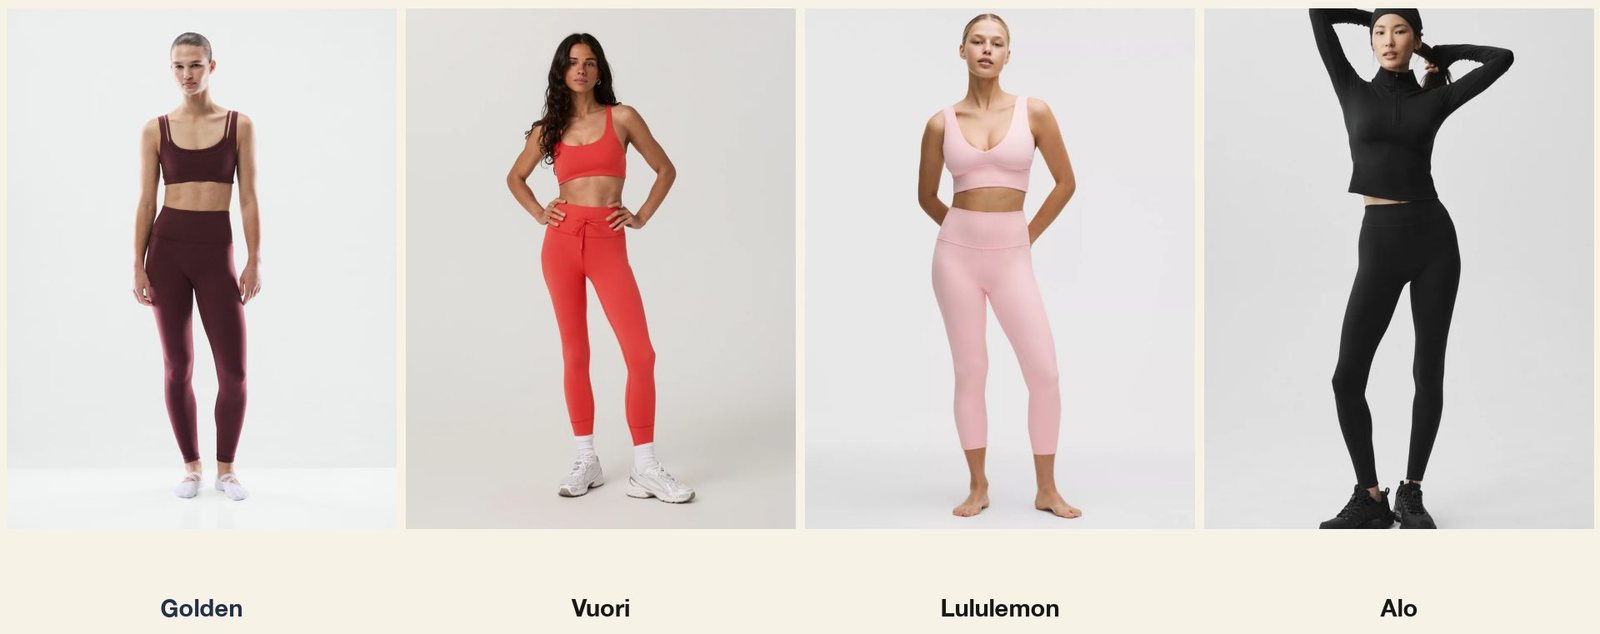
EXHIBIT 28 — Golden's current legging line clusters at $78 and $88
Golden's success was not guaranteed, and the two attempts before it show the cost of the model. Aritzia launched The Constant in 2017 and TnAction in 2022, and both activewear labels were dead within about two years. A company with one name across everything can hand its new category the strength of the whole brand.
A double-edged sword
Fourteen labels retired since 2014 and a menswear acquisition kept outside the brand: the cost of the label machine.
The label machine cuts both ways, and Aritzia runs it with unsentimental discipline. Today's labels are the survivors of more than twenty-five. At least fourteen in-house labels have been killed since 2014. The Castings died in 2015 and the denim slot sat empty until Denim Forum succeeded in 2018. SIXELEVEN, the 2014 handbag launch, was gone within two years. Community was repositioned as the sustainability label in 2020 and killed months later. Talula, one of the founding labels, was wound down in the reset that followed the 2023 slump. The pattern is consistent. Launch quietly, watch what her wallet does, and kill quietly. What looks like a curated family of brands is the output of a process that keeps shooting its misses.
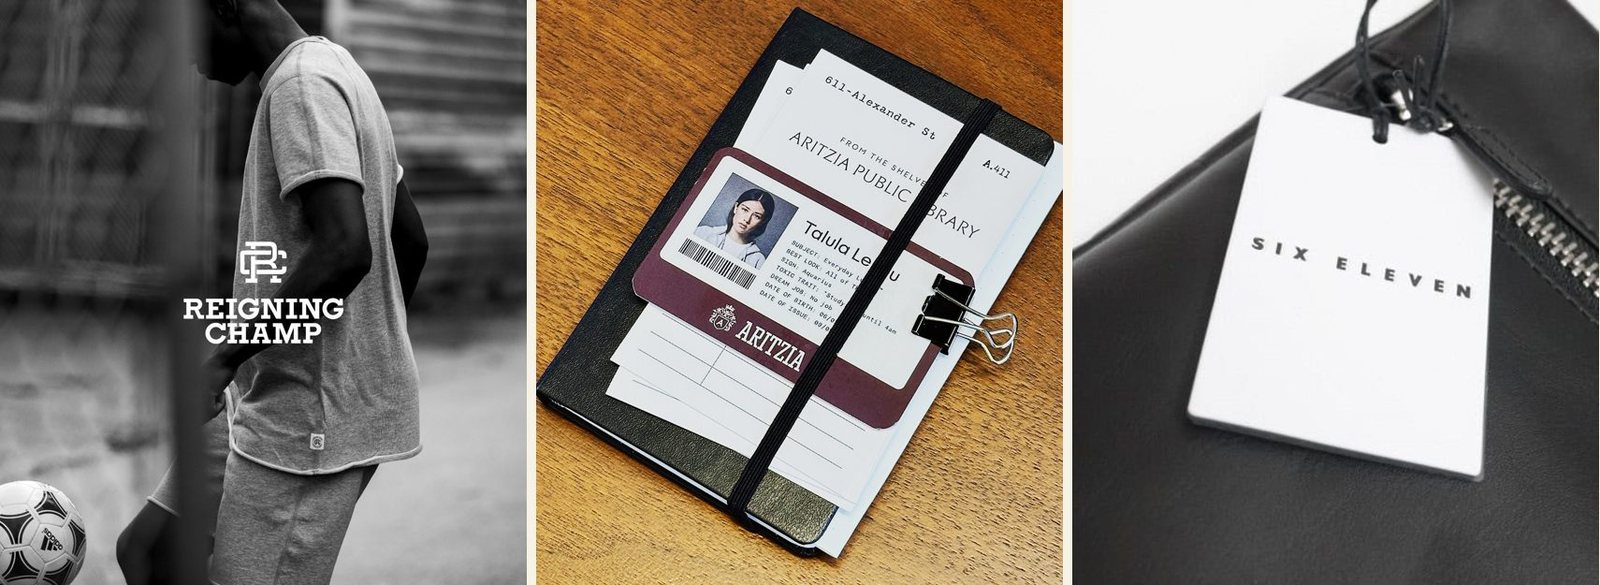
The one big swing outside her closet ended the same way. In 2021 Aritzia bought Reigning Champ, the Vancouver menswear brand, saying men's would become a meaningful part of the platform. In May 2022 management promised menswear details in the fall strategic plan. The plan arrived that October with no mention of menswear, and no strategy communication has mentioned it since. Reigning Champ was never sold in an Aritzia boutique or on aritzia.com, and it still runs as a small standalone business.
Holding price
Recurring-style list prices rose 2.6% from 2022 to August 2026 while US apparel CPI rose 7.9%.
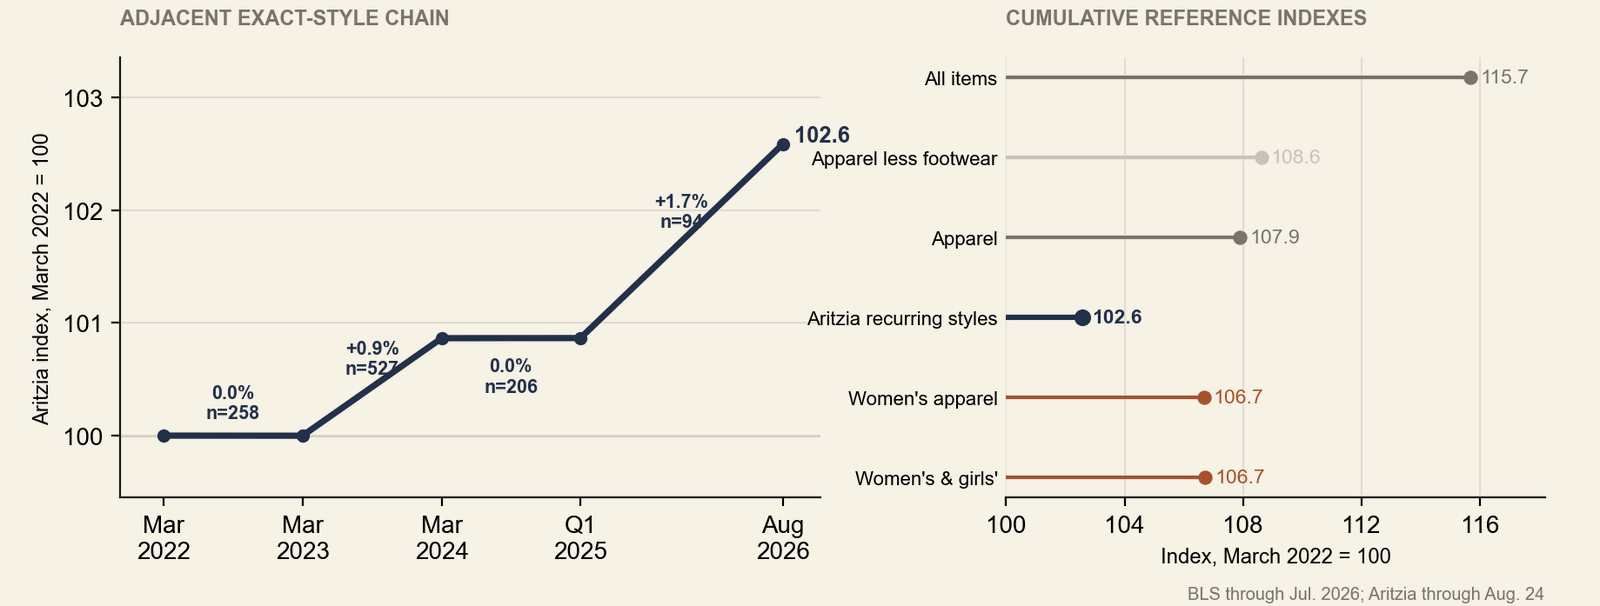
Aritzia has largely held the regular list prices of styles repeated across adjacent archive observations. The revised index matches exact style IDs one period at a time, requires at least six months between each price pair, and compounds the four links rather than requiring one garment to survive the full span. The March-centered 2022 to 2023, 2023 to 2024, 2024 to Q1 2025, and Q1 2025 to August 2026 links moved 0.0%, +0.9%, 0.0%, and +1.7%, respectively, taking the index from 100.0 to 102.6. That is a cumulative increase of 2.6%, or approximately 0.6% annualized.
The archive is effectively flat through Q1 2025; its measurable increase falls somewhere inside the final eighteen-month interval and cannot be dated more precisely. On nearly aligned, seasonally adjusted official benchmarks from March 2022 through July 2026, Apparel CPI rose 7.9%, apparel less footwear rose 8.6%, and both women-specific apparel indexes rose approximately 6.7%. Aritzia's 2.6% recurring-tag increase through August 24 was below every relevant apparel benchmark; the official CPI endpoint is one month earlier. Promotions remain separate: this is a USD regular-list-price index, not a measure of sale prices, prices paid, or the full catalog.
EXHIBIT 29 — Aritzia's recurring tags rose 2.6%—below aligned apparel CPI
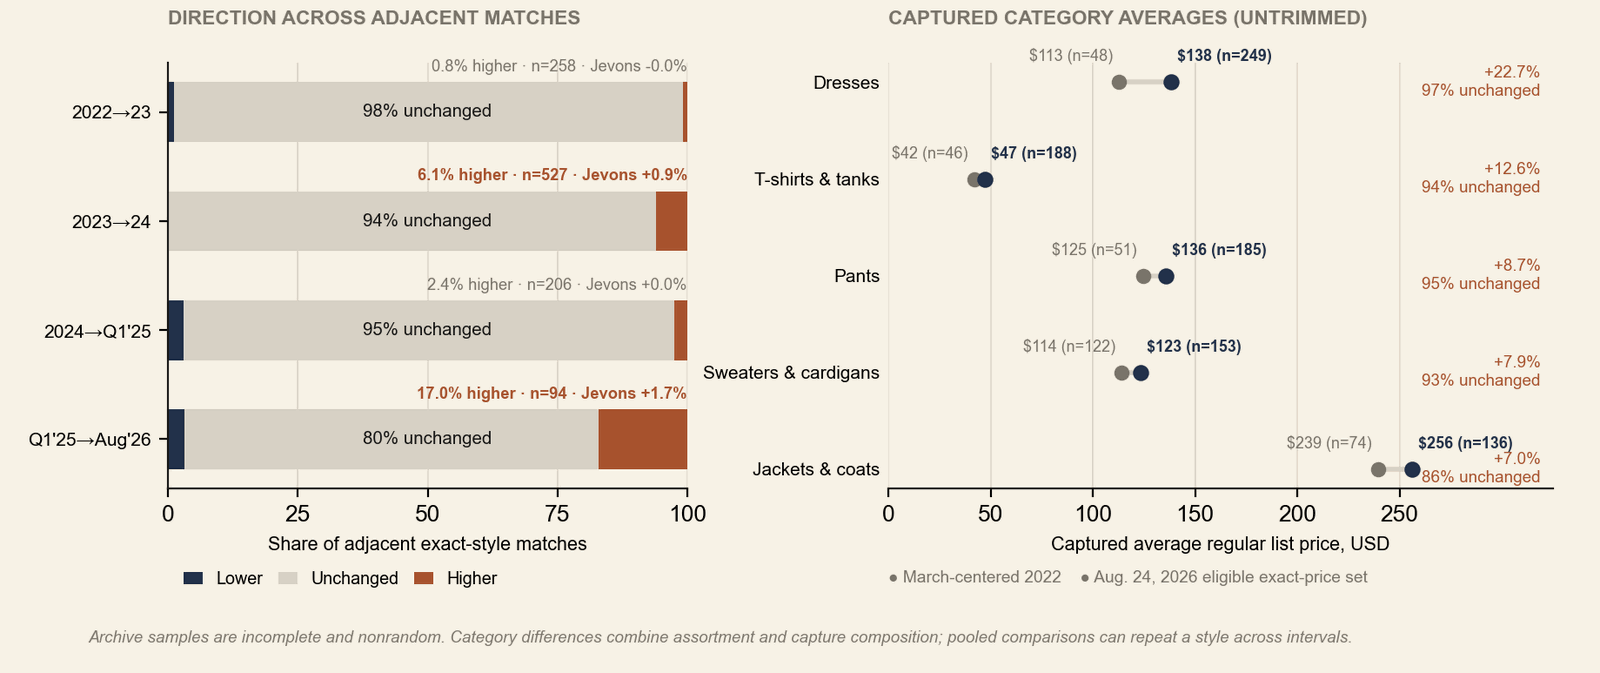
The broadest repricing falls in the latest observed link. From the Q1 2025 node to the August 24, 2026 eligible exact-price set, 16 of 94 exact style matches list higher, 75 are unchanged and three list lower. The 17% rising share compares with 1%, 6% and 2% on the three preceding links; the latest bilateral index rises 1.7%, while the median style remains unchanged. With no intermediate analytical node, the evidence cannot locate those changes within the roughly eighteen-month interval or attribute them to tariffs.
The split between recurring tags and the captured assortment remains. Across the five garment groups below, 86% to 97% of pooled adjacent exact-style regular-list-price comparisons were unchanged. Yet their untrimmed captured-category averages among eligible exact-price observations are 7% to 23% higher than in the March-centered 2022 sample. That pattern is consistent with turnover toward higher-priced products doing more work than repricing. It is not a pure assortment decomposition: the historical archive is incomplete and nonrandom, and the current endpoint excludes styles without one exact regular-list price, so capture composition remains inside the difference.
EXHIBIT 30 — Latest-link increases broadened; captured category averages rose 7%–23%
Across the four adjacent links, 1,085 exact-style comparisons span 893 unique masters. Of those comparisons, 1,017, or 93.7%, carry the same regular list price, 55 rise and 13 fall. The median pair-level change is zero overall and in every one of the four core subbrand families and five garment groups shown below. Stability is not confined to one label or garment: unchanged shares run from 93.1% to 96.9% across Wilfred, Babaton, Tna and Sunday Best, and from 85.7% to 97.2% across the garment groups.
EXHIBIT 31 — Across 1,085 adjacent exact-style comparisons, 93.7% of regular-list prices did not move

The scoreboard
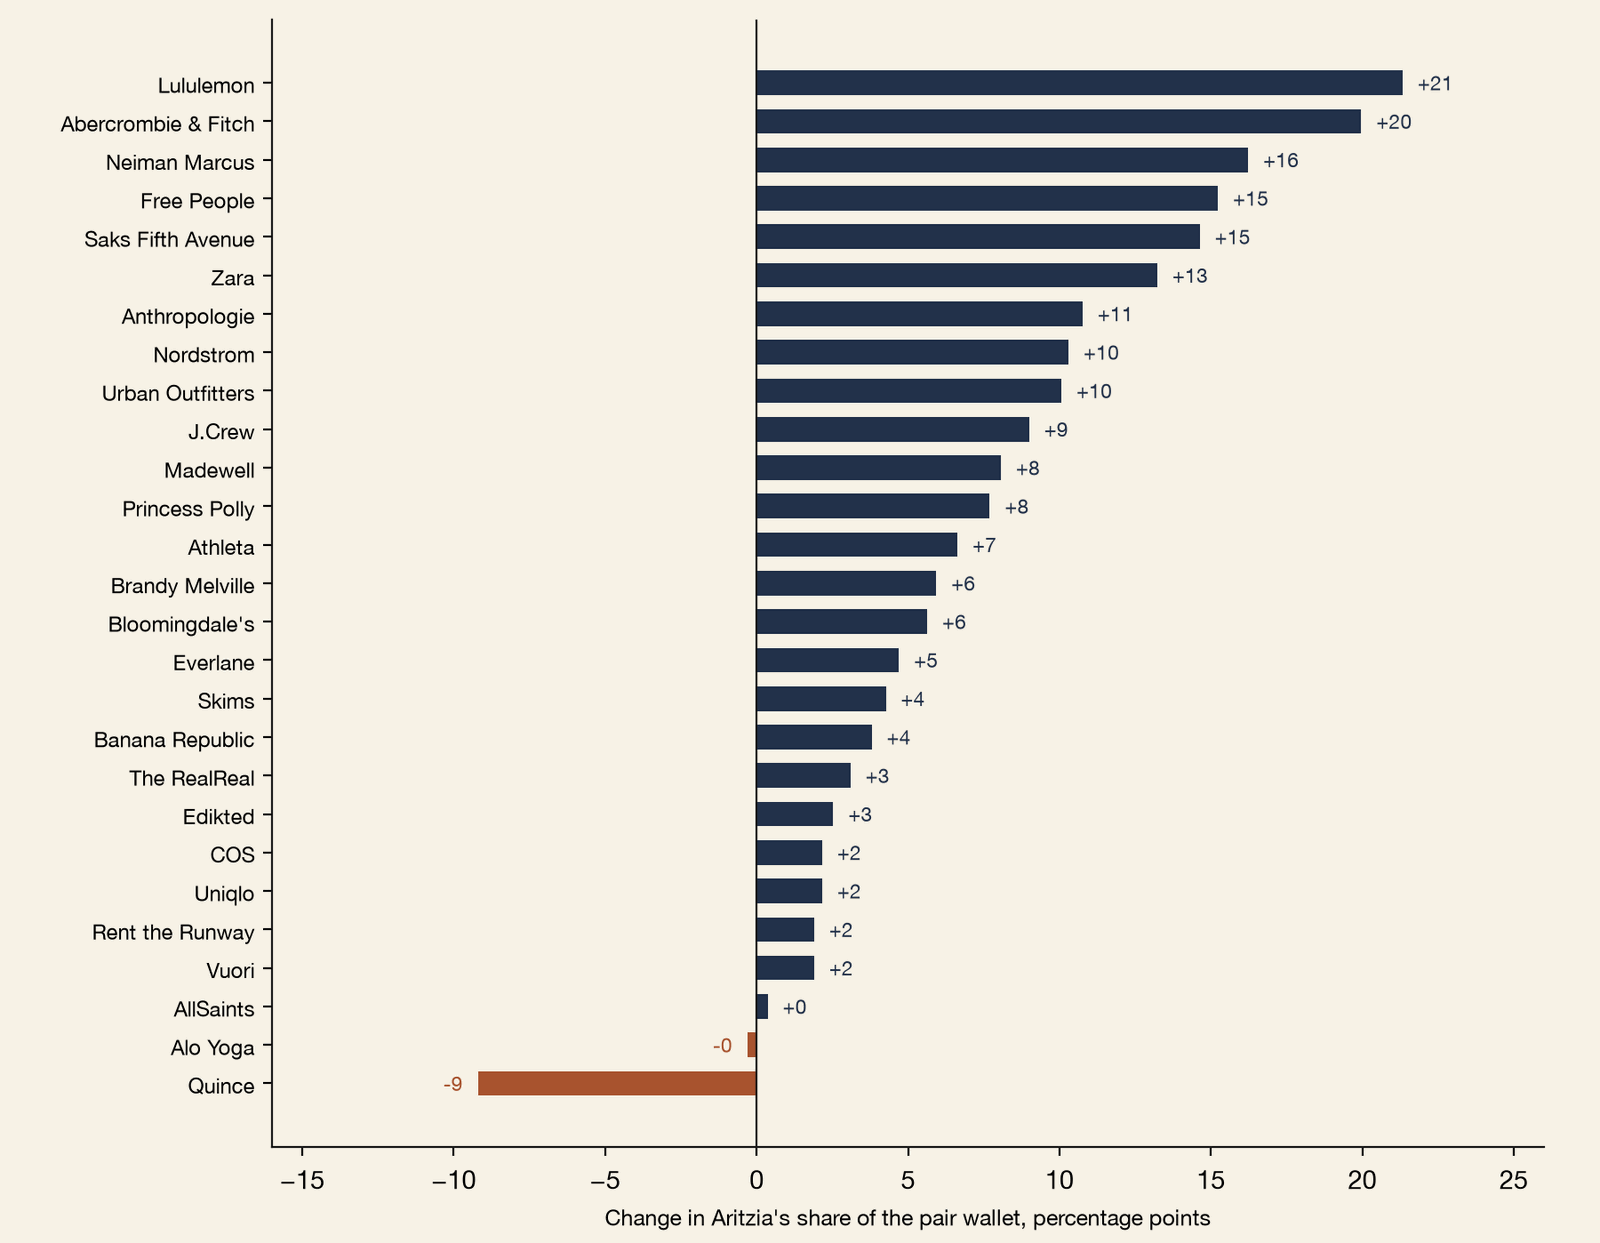
Since mid-2024, twenty-five of the twenty-seven measurable members have ceded wallet share to Aritzia, and inside its own category, against the brands that share its customer, its locations, and its price range, it is currently taking share from effectively everyone.
EXHIBIT 32 — Aritzia took pair-wallet share from 25 of 27 measurable members
Coverage
77 US boutiques, every one inside the category's densest retail, and a 180-to-200 store plan aimed at the metros where her online spend already runs highest.
Aritzia operated 44 US boutiques in January 2021. It operates 77 today, up more than 70 percent in five years. The category around it split. Its established names closed locations on net over the same stretch. Nordstrom's full-line count is lower than it was five years ago, J.Crew runs a fraction of its former base, and the department stores have kept shrinking. Its youngest members grew fast, with Alo and Vuori building from a handful of stores this decade to more than a hundred each. Aritzia sits with the growers, expanding at a pace few in the category match at its scale.
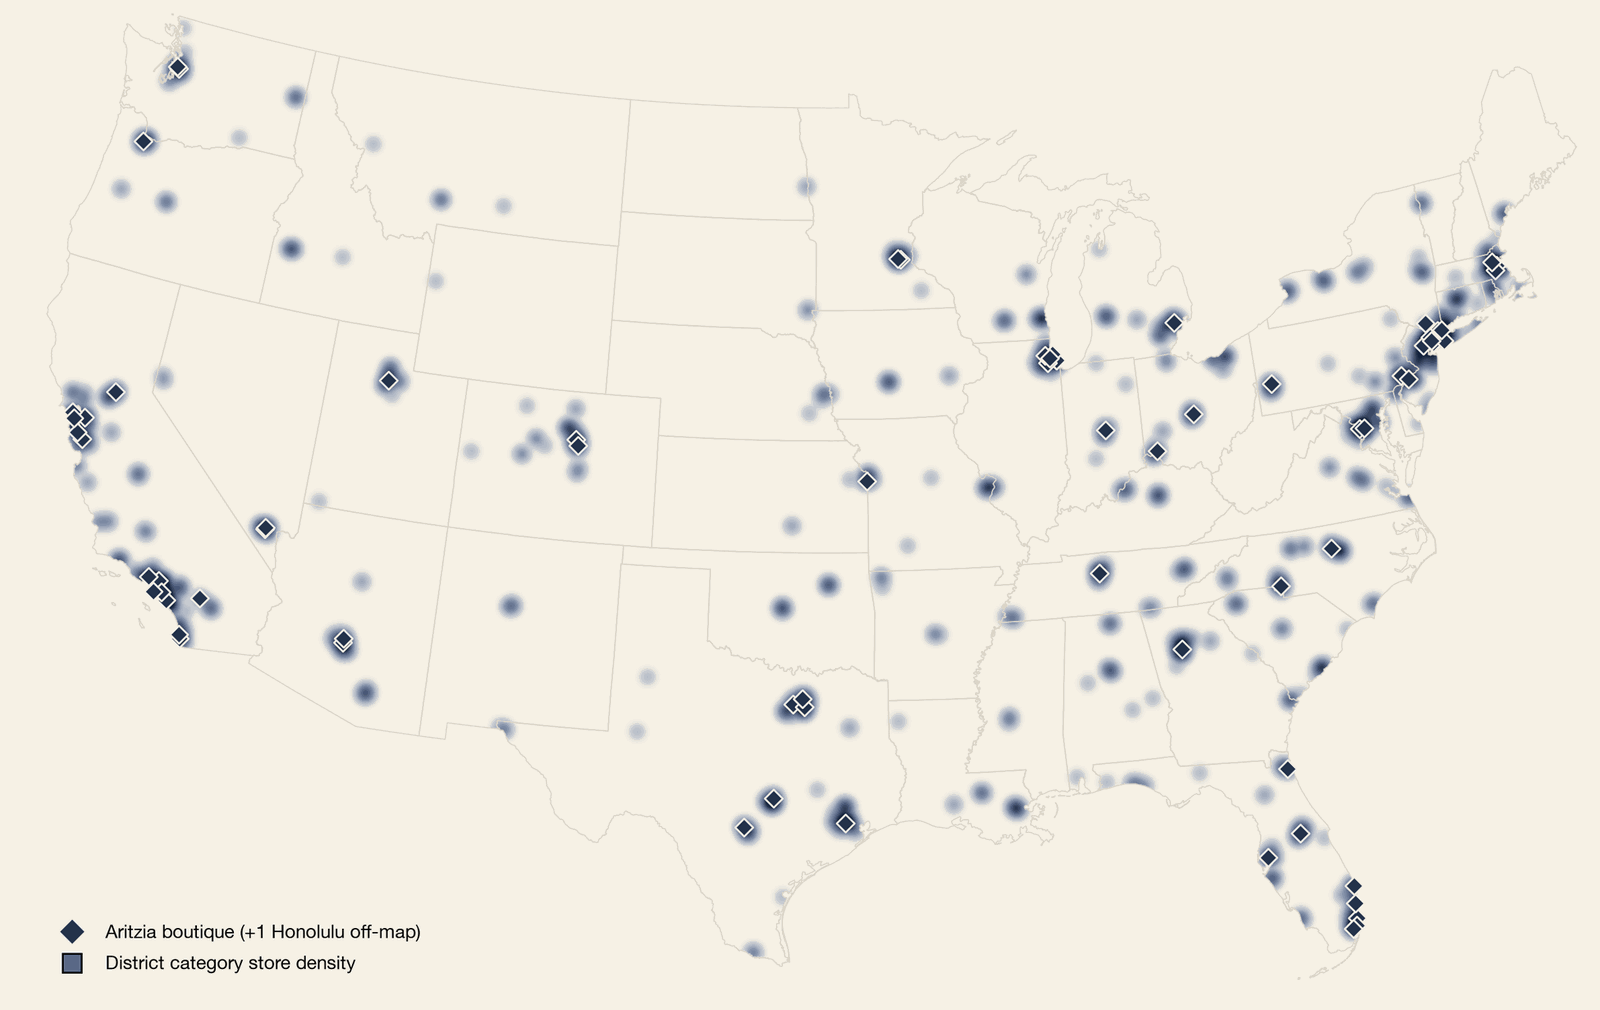
These retailers all choose the same locations, and every Aritzia boutique sits inside the category's densest shading, with a median of ten category members within two miles. The same shading also marks the areas Aritzia has yet to expand into, but that match its retail footprint. San Antonio, Sacramento, Cleveland, Oklahoma City, Louisville, Richmond and a band of mid-size metros across the Midwest and South all carry the shading.
One map, one siting playbook
Every Aritzia boutique sits inside the category's densest shading, and the five densest metros still hold room for more doors.
EXHIBIT 33 — Every Aritzia boutique sits inside the category's densest shading
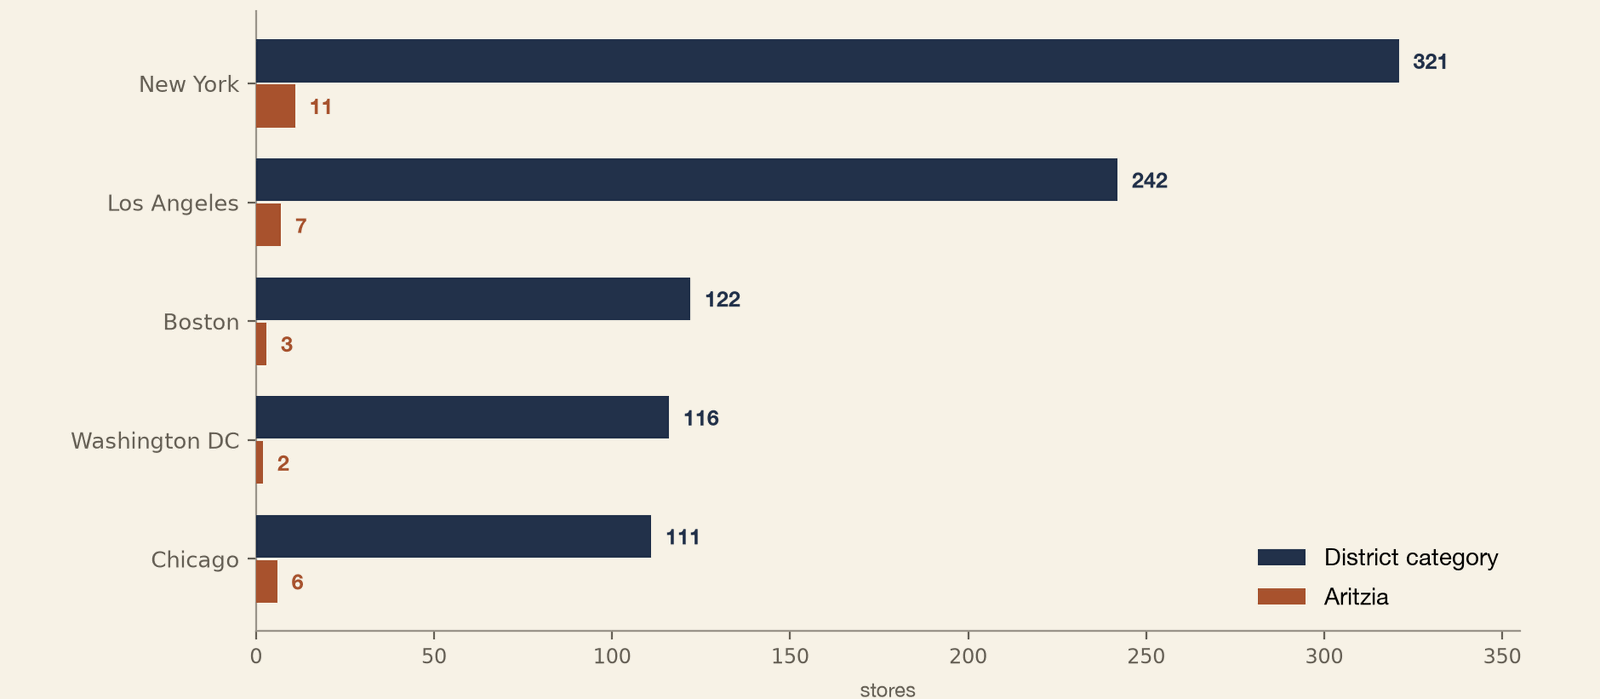
Aritzia plans to keep closing that gap. Management's long-term target is 180 to 200 or more US boutiques, and twelve to thirteen open this fiscal year alone.
EXHIBIT 34 — The five densest category metros still hold room for more Aritzia doors
Who buys, and who lives next door
The households that buy Aritzia are not the households that live beside its boutiques, and the gap explains what the stores are for.
Her two coordinates are wealth and youth. The groups that buy the brand are not the groups that live where the stores are, and the gap says more about how the stores work than about who the customer is.
EXHIBIT 35 — The households that buy Aritzia are not the households that live beside it
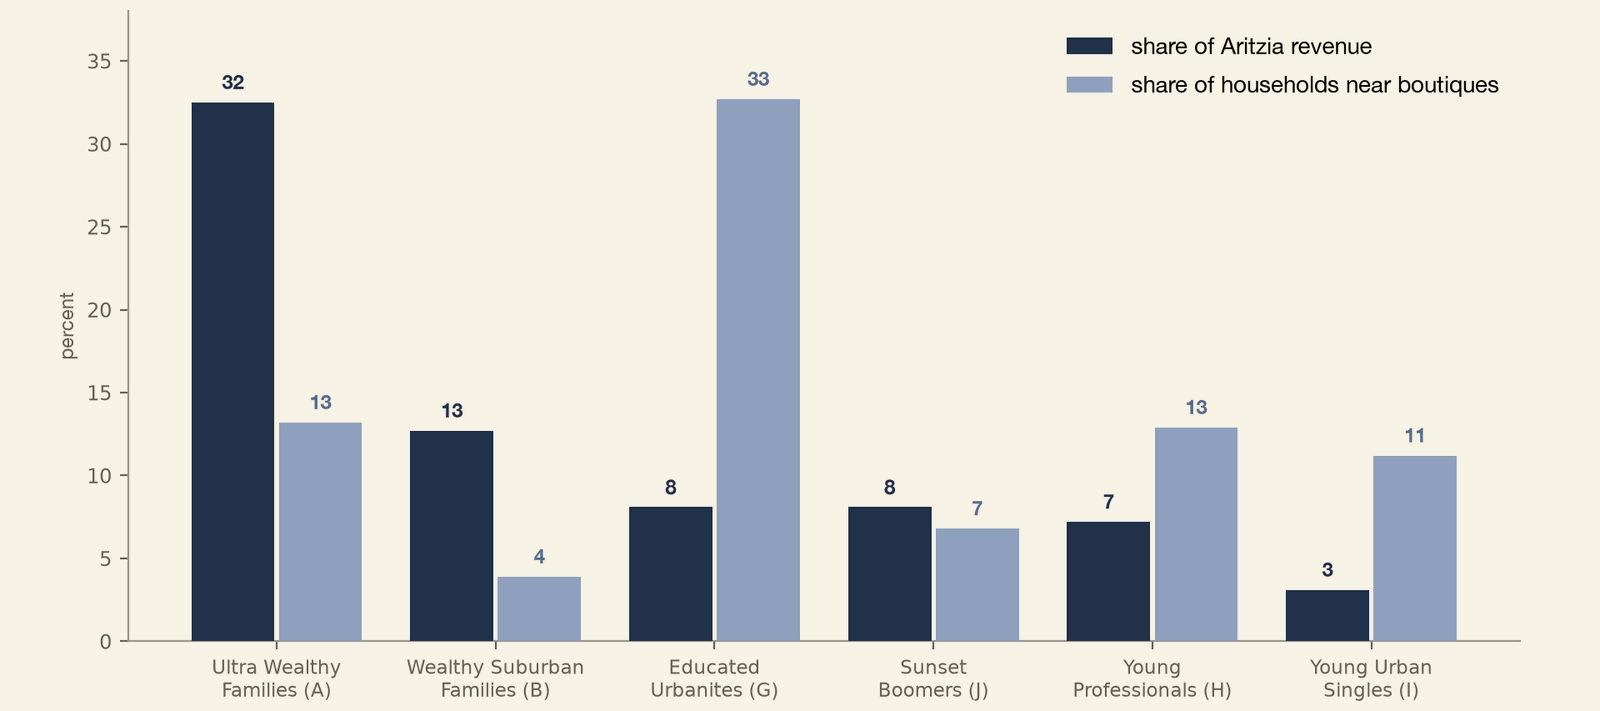
Ultra-Wealthy Families produce a third of Aritzia's US revenue and are about an eighth of the households around its boutiques. Educated Urbanites are the reverse, a third of the households around the boutiques and about eight percent of revenue. Living next door was never the requirement. The boutiques sit in white-collar commuter districts where residential rents run far past what most of the customer base pays, and she frequents these places constantly, for work, for errands, for the day in the city. A third of Aritzia's revenue arrives online with no geography at all. The store's job in these locations is presence. It advertises the brand in the districts she moves through, feeds the digital business that follows her home, and holds the aspirational ground that makes the label worth wanting. The purchase can happen at the register, or on the app that evening.
New openings and market growth
All four 2025 first-boutique markets outgrew the no-boutique markets, Phoenix by 434%.
Four markets got their first Aritzia boutique in calendar 2025. Phoenix, Salt Lake City, Pittsburgh and Cincinnati. In the six months from December 2025 through May 2026, Aritzia spend grew 434 percent year over year in Phoenix and more than doubled in each of the other three.
Phoenix is different from the other three, and the difference explains the size of its number. Its first boutique opened at Kierland Commons in Scottsdale, where established wealth dominates the surrounding households. Ultra-Wealthy Families are 19 percent of residents there and Sunset Boomers 29 percent, against low single digits for the wealthy groups around the Pittsburgh and Salt Lake locations. A second boutique followed at Scottsdale Fashion Square in December. The wealthiest first market got two doors and produced four times its own baseline. All four markets compare with 60 percent growth over the same period across markets that have no boutique.
EXHIBIT 36 — All four 2025 first-boutique markets outgrew the no-boutique markets
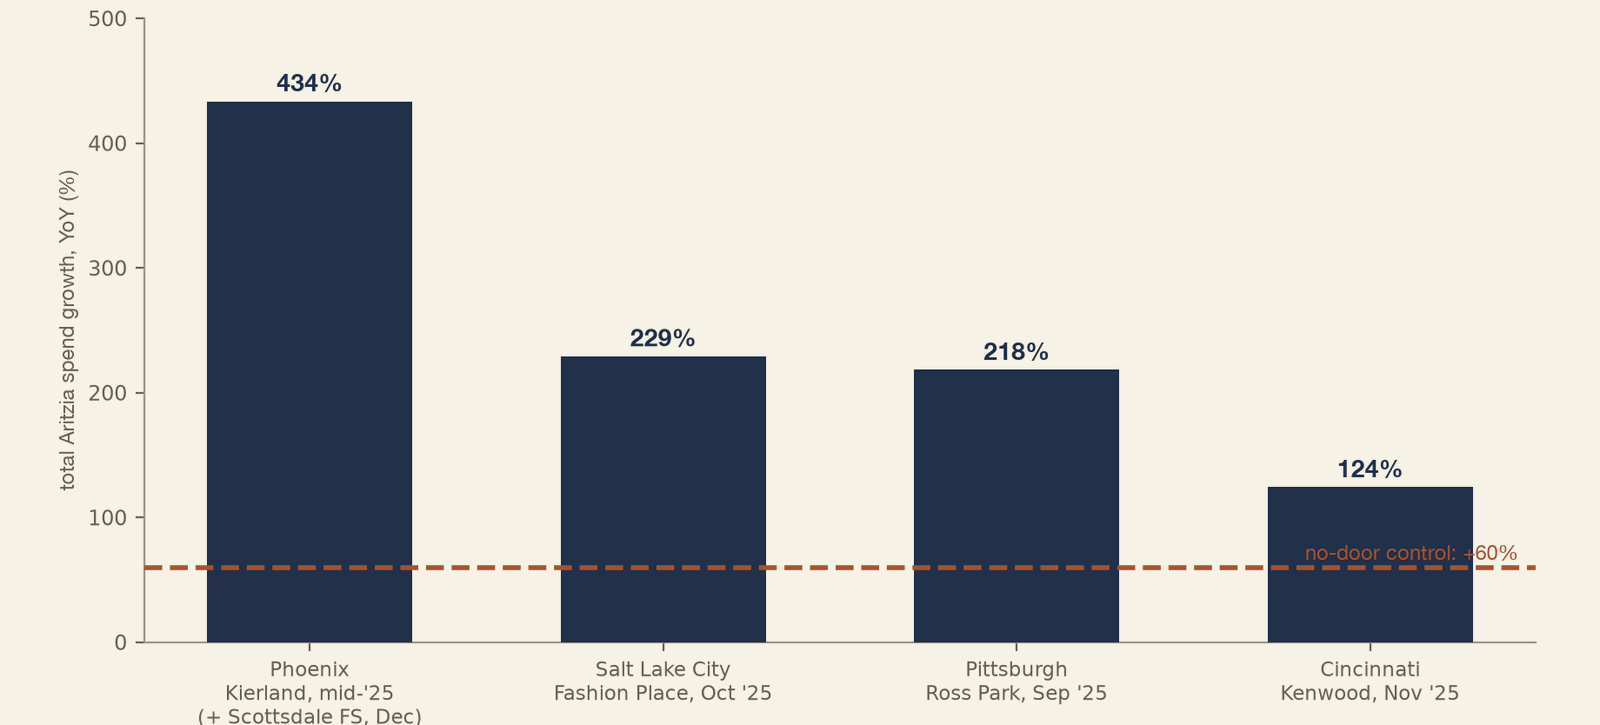
Management describes its boutiques as the brand's best advertisement, and says new stores lift the online business around them. The panel is consistent with it. Online Aritzia spend in the four first-boutique markets grew between 73 and 155 percent after the stores opened, on top of the in-store sales the locations added. Four markets selected after the fact, one of which received a second boutique inside the window, are not a controlled design. The pattern is consistent across all four rather than evidence that the openings caused it, and a matched-control study would be required before making the stronger claim.
The two findings together reveal the choice inside every opening decision. Aritzia has established itself nationally and aspirationally with large statement stores in places like the Flatiron district, where the buying base does not mainly live. Those locations build awareness and drive the digital business. When it opens where the base does live, as in Phoenix, in-store results are tremendous. Where the surrounding demographics line up less cleanly, as in Salt Lake City, the return leans back toward awareness. Each new location is a position on that spectrum, marketing reach at one end and direct connection with the base at the other, and the mix Aritzia chooses will shape what the next hundred boutiques are for.
Aritzia has announced 12 to 13 new boutiques for fiscal 2027, nearly all in the US. The named markets are New Orleans, Fort Worth, Birmingham, St. Louis and Cleveland, plus additional stores in Dallas, Atlanta, Las Vegas and Florida, Columbus Circle in Manhattan, and Carlsbad. Every announced opening either expands an existing market or lands in a category-dense area, with no exceptions among the markets named so far.
Retail is building off the migration south. CoStar ranks the strongest US retail metros, and its 2025 list puts Charlotte, Tampa, Orlando and Dallas at the top, with Phoenix, Nashville and Miami close behind. Aritzia's location choices reflect the ranking almost line by line. It now has stores or announced stores in every one of those markets except Norfolk.
Several metros have high online Aritzia spend, sit in category-dense areas, and have no boutique. Staying consistent with current patterns, these are the likely next openings. Richmond leads, buying online at more than four times the rate of the average no-boutique market.
The openings follow the map
Every announced fiscal 2027 opening lands on existing category density, and Richmond leads the likely next markets.
EXHIBIT 37 — Every announced fiscal 2027 opening lands on the category's existing density
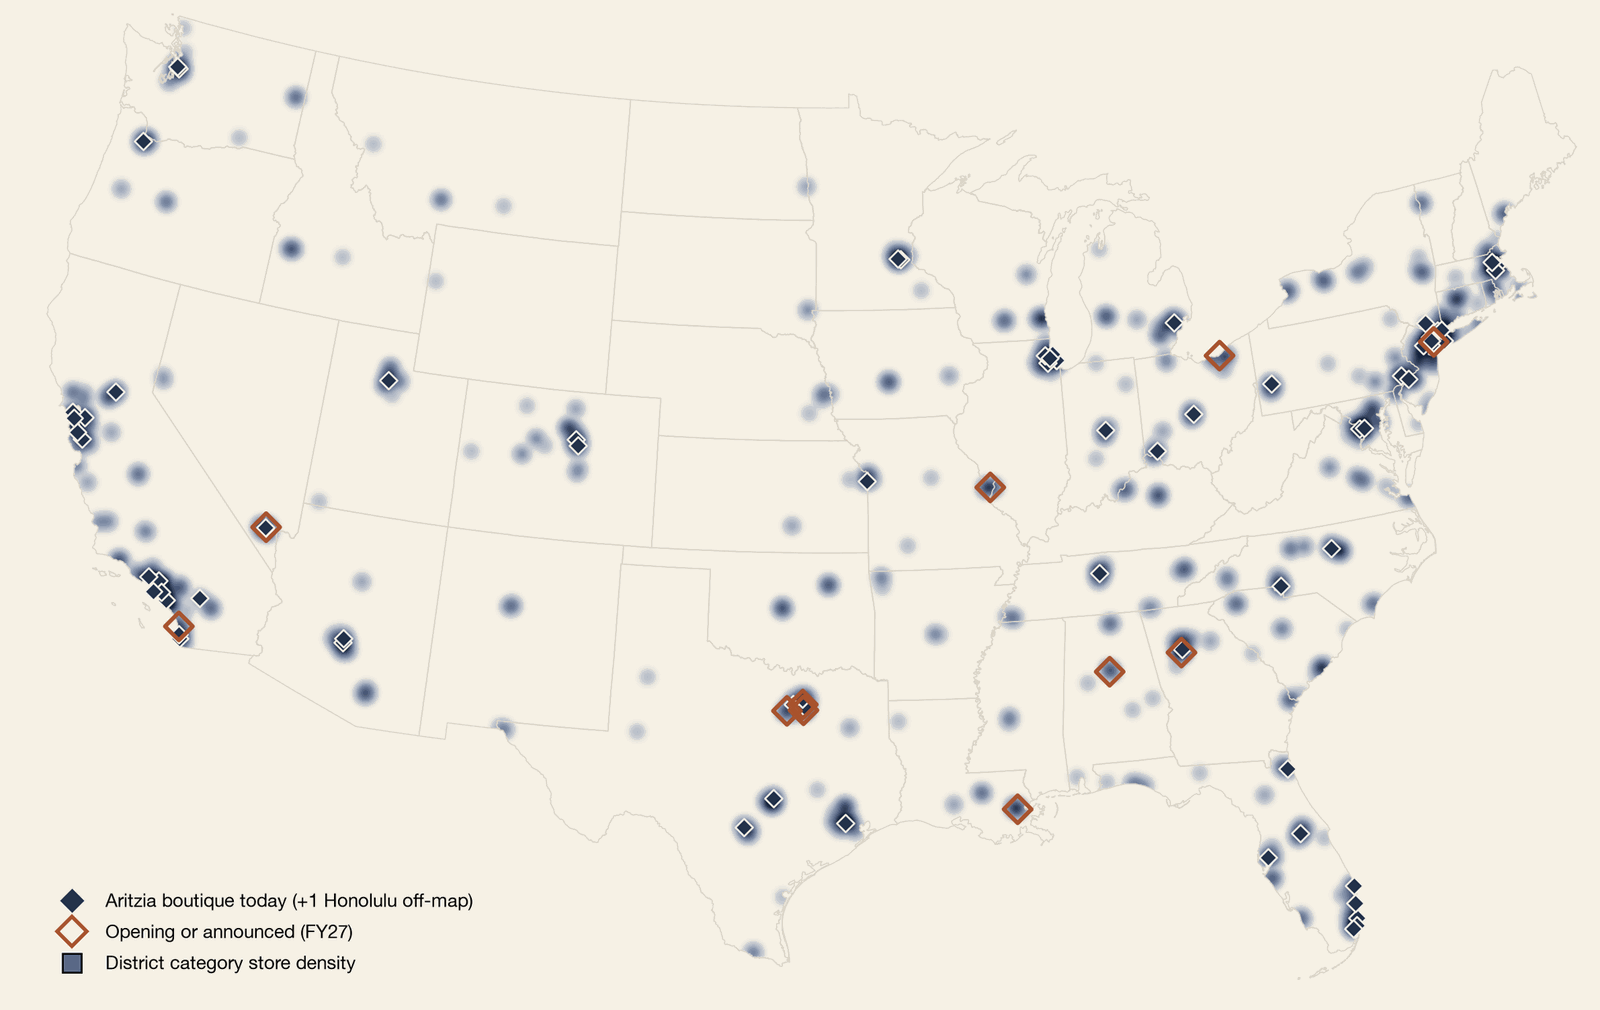
EXHIBIT 38 — Richmond buys Aritzia online at more than four times the no-boutique average
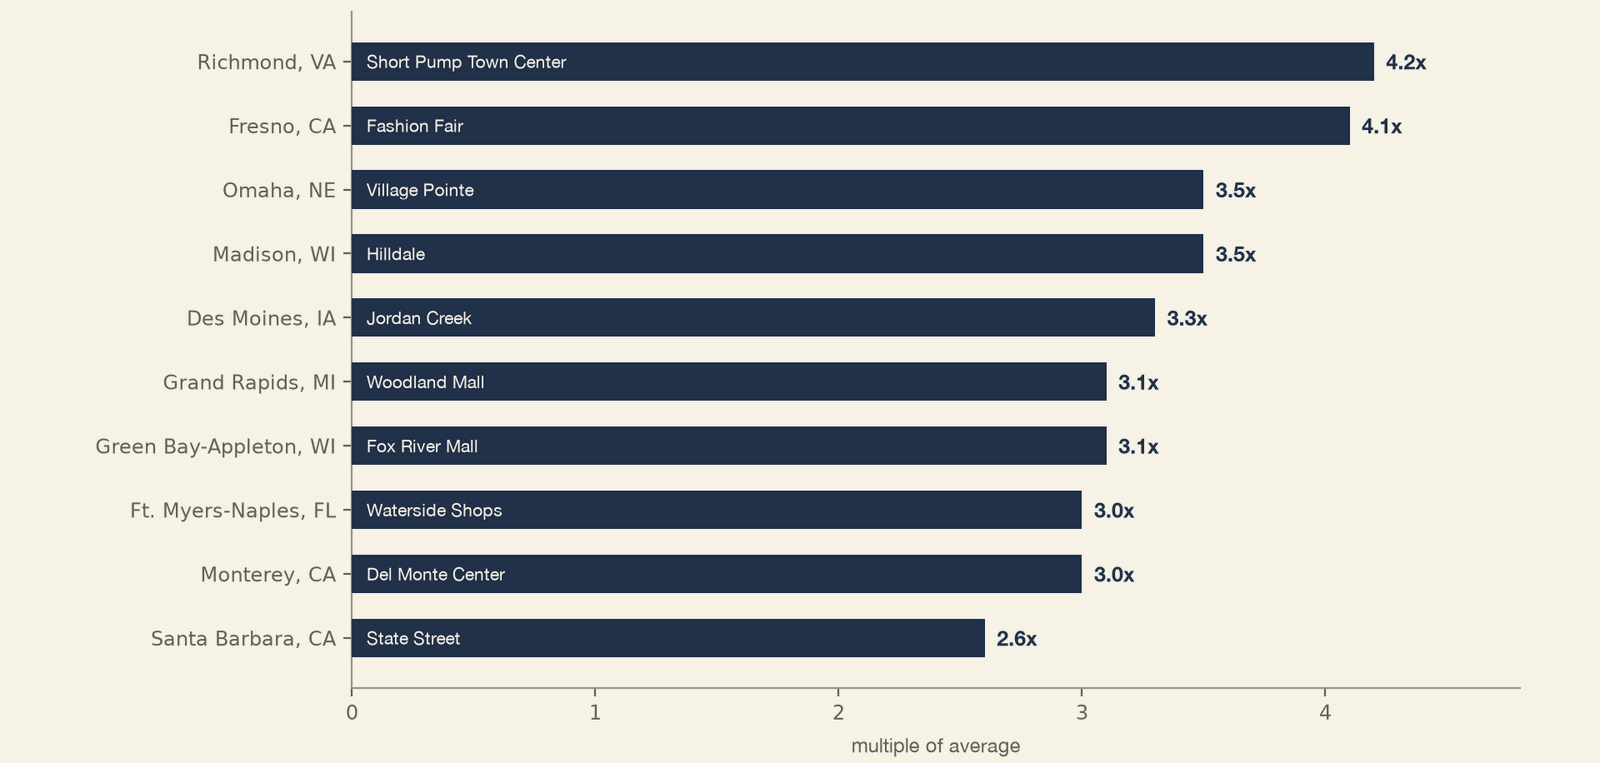
The residential pulls at those nodes point the same way. Around the ten likely locations, from Short Pump in Richmond to Village Pointe in Omaha, the household profile matches the markets Aritzia is already choosing. Ultra-Wealthy Families run at the same share as around the current boutiques, and Young Professionals slightly higher. On the household measures available, none of the ten reads as a stretch market. They profile like the fiscal 2027 class, one announcement earlier.
Retail's trajectory
Record-low availability, department-store exits, and larger formats built to hold the full wardrobe of exclusive brands.
US retail availability was 4.9 percent in the first quarter of 2026, near its record low, and new supply hit the lowest quarterly figure CBRE has ever recorded. A retailer planning to triple its store count needs someone else's space. The losing brands of the category's re-tenanting are vacating the strongest centers and districts on schedule, and Aritzia's openings have gone into exactly that space.
Its one US closure makes the same argument from the other side. Aritzia left Northbrook Court, north of Chicago, in late 2025. The households around Northbrook Court are the wealthiest of any Aritzia site measured, with Ultra-Wealthy Families at 54 percent of residents. The demographics were never the problem. The property was. Macy's announced its exit in 2019 and the store was demolished. Lord & Taylor followed in 2020. A $750 million redevelopment was unveiled in 2023 and never broke ground. In 2025 the premium tenant roster left as a bloc, with Apple, Lululemon, Sephora and Louis Vuitton all closing alongside Aritzia. The same siting logic that groups these retailers together on the way in takes them out together when a center fails.
The larger formats explain what the space is for. Average boutique size has climbed from six thousand square feet toward ten thousand and above over the past decade. Columbus Circle is signed at roughly 16,000 square feet. A four-level, 40,000 square-foot Vancouver location opens in 2027 in a building that previously held a Nordstrom. The comparison to the departed department stores is about the model, not the symbolism. A department store filled its square footage with other companies' brands and kept a lease economics margin on them. Aritzia fills the same square footage with its in-house labels, the full wardrobe under one roof. More floor means more of its own labels presented together, and because 97 percent of revenue is exclusive brands, the margin on every additional square foot is its own.
The digital half of the map
Aritzia's digital business was 35 percent of revenue in fiscal 2026, peaked at 41.2 percent in the holiday quarter, and grew 55.5 percent in the most recent quarter, faster than the stores. The 180-to-200 plan is built on that channel, not against it. Boutiques advertise the brand, online sales rise where they open, and online demand points to where stores are missing, with six metros holding a dozen or more District category stores and no Aritzia, Baltimore the largest. The store map decides where the brand is present. The digital business decides how fast presence becomes scale.
Campaign
One message, Everyday Luxury, held for twenty years across products, stores, and the app, with no repositioning through four eras.
Everyday Luxury has been Aritzia's phrase for twenty years. The company's own history announces the first US boutique, in 2006, with the words "USA, meet Everyday Luxury." The slogan was filed for trademark in May 2021, registered in October 2024, and today it is the company's Instagram bio. Aritzia's campaigns do not advertise products. They advertise the position, and the message has never been as effective as it is right now.
EXHIBIT 39 — One message, four eras, no repositioning
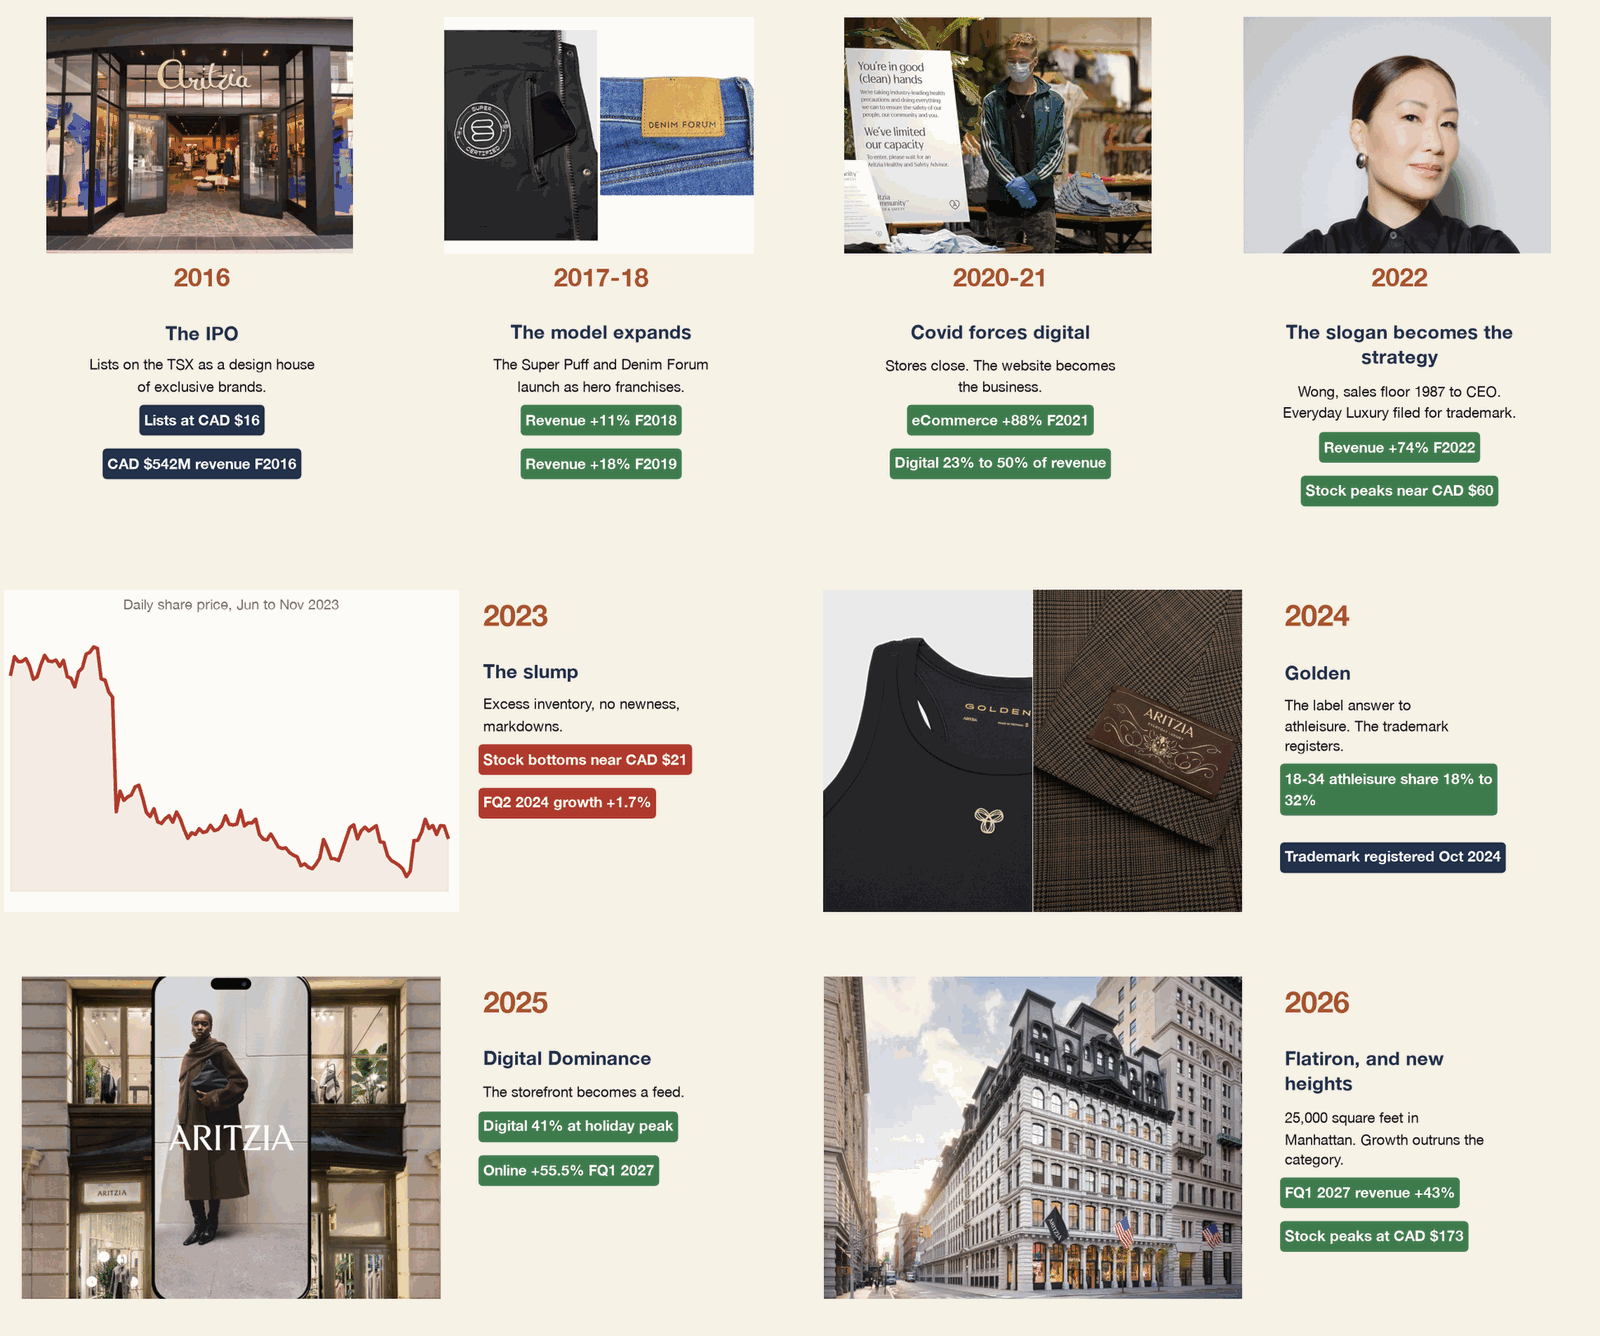
2016 to 2020
The products were the campaign: the Super Puff, Denim Forum, and a launch cadence that revenue followed.
The early campaigns were the products themselves. Aritzia listed in October 2016 as a design house of exclusive brands, and its marketing ran through hero garments rather than advertising buys. The Super Puff arrived in 2017 as outerwear engineered to be photographed, in colors built for a feed. Denim Forum arrived in 2018 as vintage silhouettes returned. Each launch was the season's campaign, and revenue climbed with the cadence.
2020 to 2022
Covid pushed the business online, e-commerce reached half of revenue, and management refused to treat it as temporary.
Covid closed the stores and nearly a third of the year's revenue with them. The response set up everything since. The company pushed its assortment and its spending online, and eCommerce grew 88% in fiscal 2021 to reach half of net revenue, from 23% penetration the year before. The e-commerce machine that defines Aritzia today began as an emergency measure that management refused to treat as temporary.
2022 to 2024
Jennifer Wong made the slogan the strategy, 2023 broke the message, and Golden repaired it.
Jennifer Wong became CEO in February 2022. She joined the company as a sales associate in 1987, and the read she carries of the brand comes from thirty-five years inside it. Under Wong the slogan became the operating strategy, filed for trademark nine months before her appointment and applied to everything from assortment to architecture. Revenue rose 74% in fiscal 2022 and the stock touched CAD $60. Then 2023 broke the message. Excess inventory met a season the company itself described as lacking newness, and the marketing that reached the customer was markdowns. The stock bottomed near CAD $21. The repair came through the label machine. Golden launched in April 2024 into the pilates moment, and among customers aged 18 to 34, Aritzia's share of spending across the four big athleisure brands has climbed from 18% to 32% since. The Everyday Luxury registration arrived from the trademark office in October 2024, the same season the growth returned.
2025 and 2026
The app, the Flatiron store, 43% growth against a category near 5%, and a record stock price.
The last two years cement what was already built. The app launched in October 2025. The Flatiron store opened its 25,000 square feet in Manhattan. FQ1 2027 (March-May 2026) revenue grew 43% against a category growing near 5%, and the stock closed at a record CAD $173 in June 2026. The line lands harder now than it did in 2016. The current consumer wants the signals of luxury at prices her income clears, and the climate keeps producing more of her.
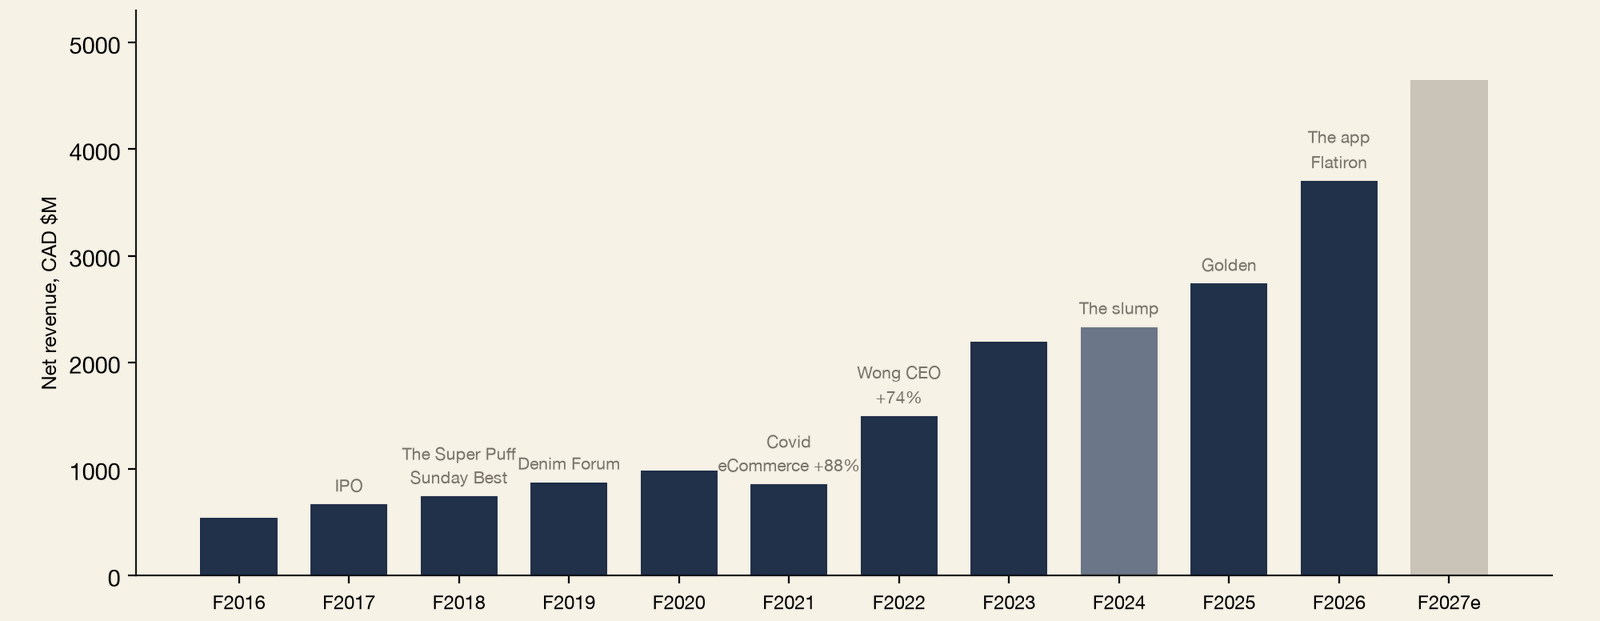
EXHIBIT 40 — Revenue compounded through every event of the decade except fiscal 2021
Commerce moves to the feed
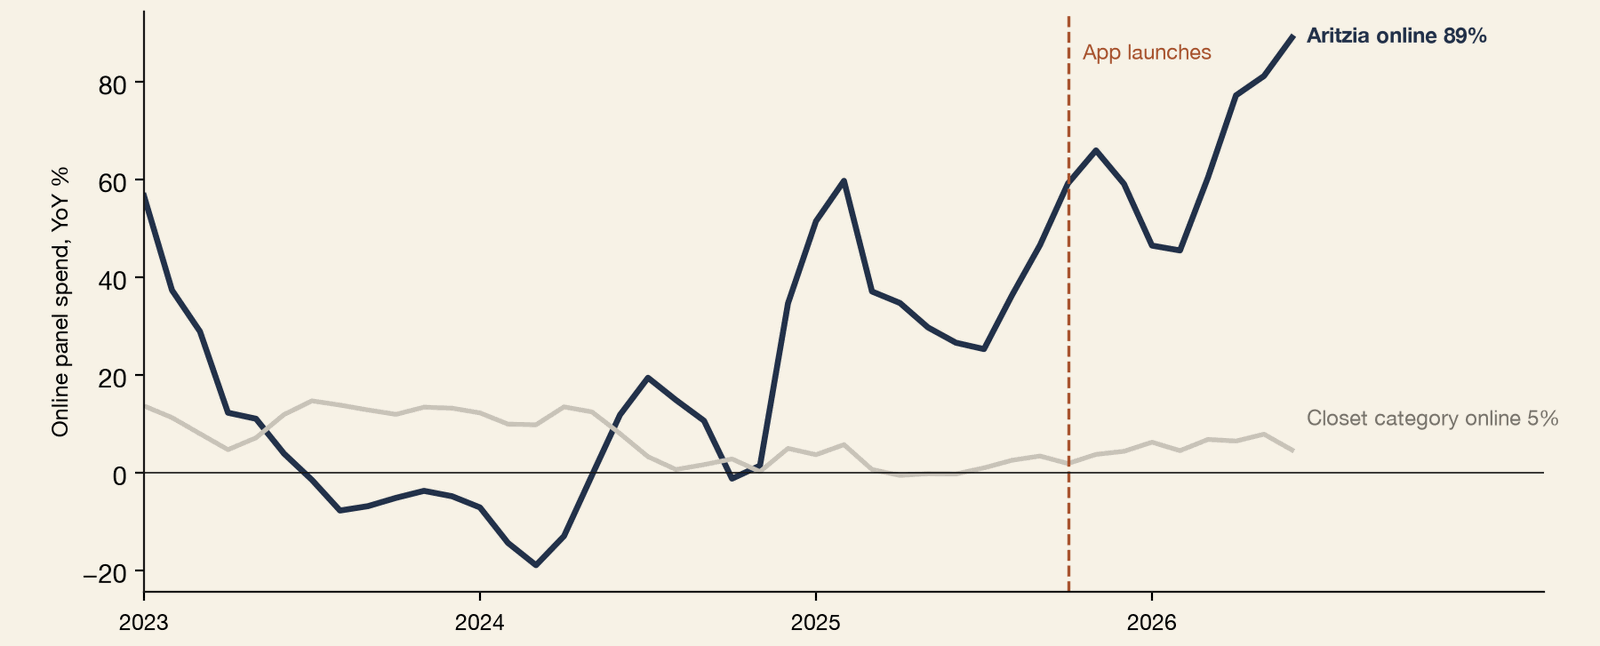
The app opens to a feed, prices appear only on tap, and online spend has grown near 70% a year since launch.
Social media is where fashion demand forms now, and where a growing share of it transacts. Aritzia's app executes that shift expertly. It opens to a feed of curated posts, all of it company messaging that reads like independent creators' content. The clothes accompany the message and are integrated into it. No price appears until a small garment icon is tapped, and then every piece in the frame is shoppable. The app borrows its design from the platforms that shaped how a generation of fashion-minded women consume imagery. VSCO, Instagram, and Tumblr are all visible in its bones, and borrowing from them is its own signal that Aritzia pays attention to who its customer is and where her taste was formed.

Online panel spending accelerated through the launch quarter and has grown near 70% year over year since, against 3% for the Closet category. Digital delivered 35% of fiscal 2026 revenue, 41% at the holiday peak, and grew 55.5% in FQ1 2027. The App Store rating pace, a 4.9 average accumulated in months, runs ahead of peer apps years older.
EXHIBIT 41 — Online spend accelerated through the app launch and has run near 70% since
The store as the campaign
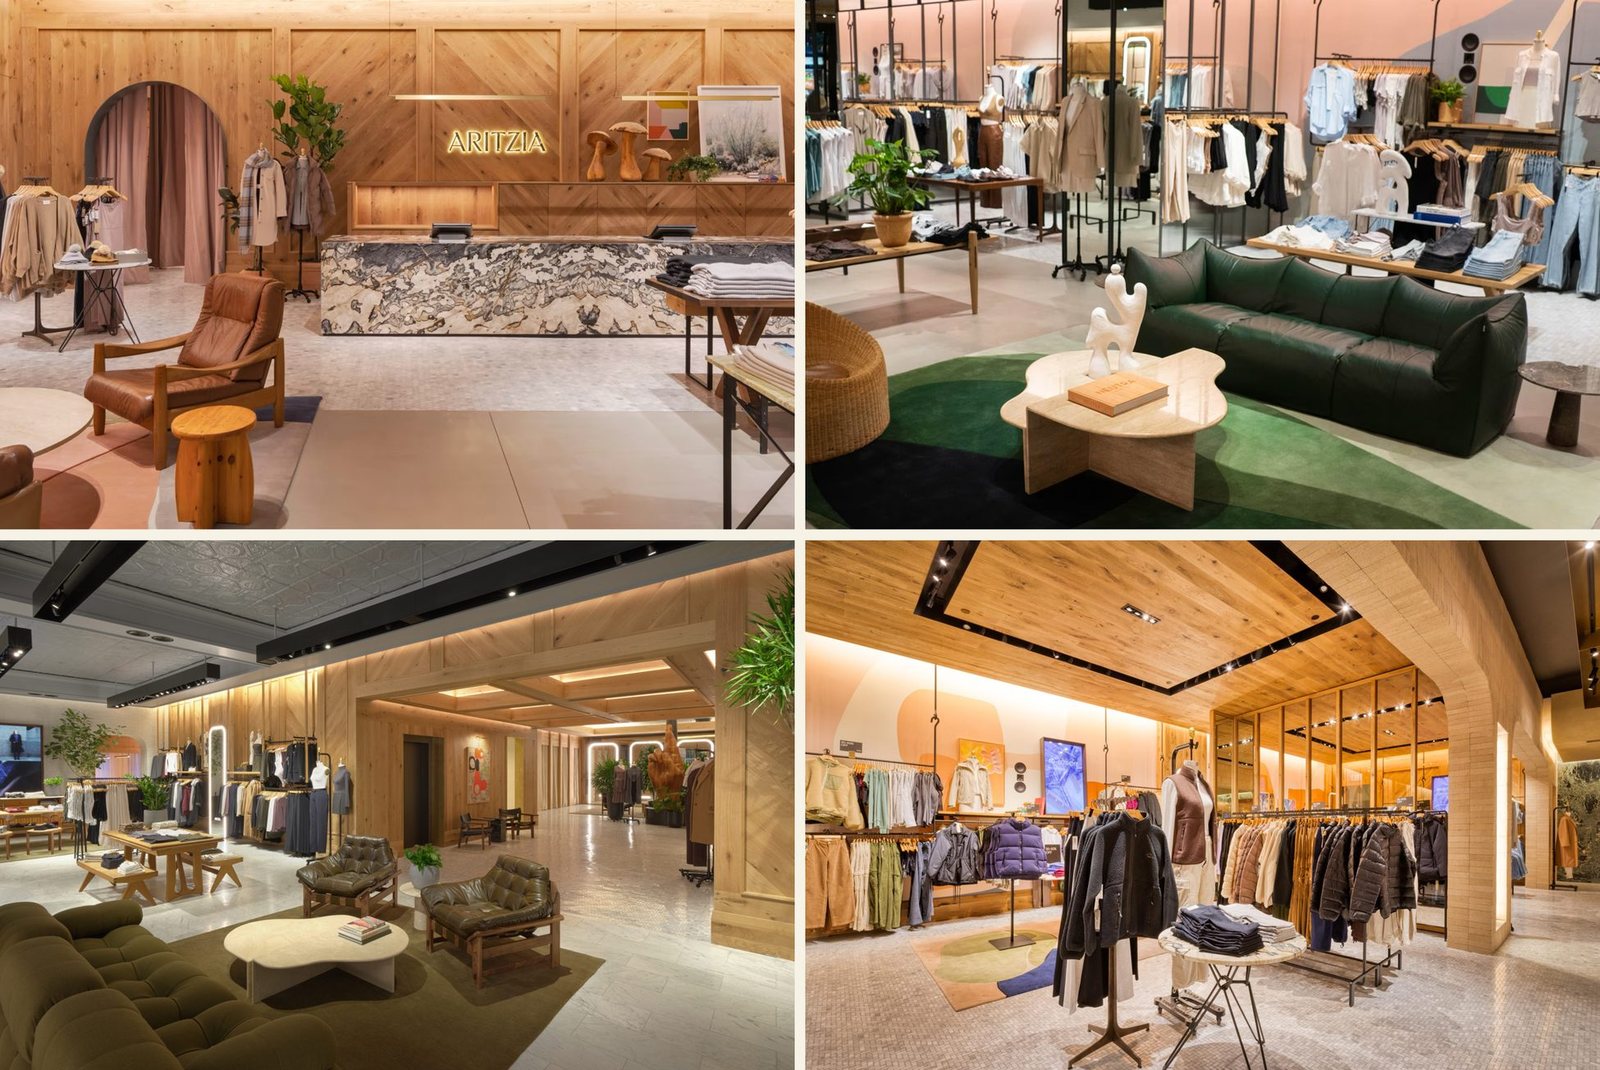
Boutiques built like galleries with no unified logo treatment, because the brand is the labels inside.
The SoHo opening in November 2024 came with a first-look event attended by Martha Stewart, Irina Shayk, and founder Brian Hill, covered by the fashion press before a customer walked in. The format is the survivor of a decade of experiments. Aritzia spent the 2010s testing standalone Wilfred, TNA, and Babaton stores and quietly froze the idea, and the SoHo space itself began as the Super Puff pop-up before becoming the boutique. The filings describe boutiques as brand-propelling. The stores carry no unified logo treatment, because the brand is the labels inside. Some carry an in-house café. The interiors run to marble, gallery lighting, and space most retailers would fill with racks.
The campaign is one decision, held with total commitment. Everything the company builds sells the same position, from the architecture to the app, and that consistency is a large part of why the position works. It pairs with a correct early read on where e-commerce was going, and with a deep understanding of a customer the company still refuses to explicitly define. The refusal is part of the message. Everyday Luxury names the position, and she recognizes herself in it without being told.
Conclusion
The verdict, the three structural decisions behind it, the brands to watch, and what the panel says about fiscal 2027.
The verdict
Aritzia is winning. Six straight quarters of revenue growth above thirty percent, in every channel and every geography. A share of the Closet category that has roughly tripled since 2022, from 1.4% to 4.4% in June 2026 on a three-month average of 3.8%, while the category itself went flat. Online dominance that keeps widening, with Aritzia's online spend up 102% over a trailing year in which the category's grew 2%. A retail expansion just getting started, with 77 US boutiques today against a stated potential of 180 to 200-plus. And a competitive record with no real precedent in the data. Aritzia competes simultaneously with department stores, athleisure brands, workwear labels, denim specialists, and fast fashion, and since mid-2024 it has taken wallet share from 25 of the 27 rivals tracked.
The blueprint
What allowed it is not a campaign or a hot product cycle. It is three structural decisions hardcoded into the business since its inception, each compounding for decades.
The first is the exclusive brands. Aritzia has operated as a design house of exclusive brands since the beginning. In-house labels, each with its own aesthetic and occasion, sold nowhere else. For most of retail history this looked like a merchandising choice. It became a structural moat when the multi-brand model died. The department stores and wide-selection boutiques that anchored womenswear are shrinking or gone, and when the shelf of other people's brands stopped working, the companies that owned their shelf kept the customer. A rival cannot retrofit this without becoming a different company.
The second is Everyday Luxury. In company use since the 2006 US entry and registered as a trademark in 2024, it is an operating specification, not a slogan. The design choices are luxury, from the fabrics to boutiques built like galleries. Price discipline is part of the proof. Aritzia's adjacent-period recurring-style index rose 2.6% from its March-centered 2022 base through August 24, 2026. Over the nearly aligned March 2022 to July 2026 window, seasonally adjusted US Apparel CPI rose 7.9% and the closer women-specific indexes rose approximately 6.7%. Despite the one-month endpoint lag, Aritzia's recurring tags rose less than every relevant apparel benchmark.
The third is the customer understanding. Aritzia refuses to define her publicly, and the refusal works because the company knows her better than its filings admit. The label architecture captures her across her whole life. Our panel shows every age band contributing while the base replenishes from below.
What to watch
The brands to be aware of in relation to Aritzia. Quince is the fastest-growing member of the category, up 128% year over year on the value flank, and it is the one name rising meaningfully inside her online wallet. Alo presses from premium athleisure, though its gains so far have come out of Lululemon's share rather than Aritzia's. Aritzia's own record shows how hard that flank is to hold. Two of its activewear labels died before Golden stuck. Reformation is the profile twin one price tier up, growing slower but aging better than the rest of the field.
Second, e-commerce's next turn. Commerce keeps moving into feeds and social checkout, and Aritzia currently leads a format it did not invent. The question is whether it keeps leading the next one.
Third, the things that could break the Everyday Luxury promise. The recurring-style index was effectively flat through Q1 2025, then rose 1.7% somewhere inside the interval to August 2026. Every relevant apparel CPI measure rose faster across the near-aligned span. The price discipline is real: recurring tags fell in real terms against each benchmark, although the matched-style index does not cover the full catalog. If pressure eventually forces broader tag increases, the gap the brand occupies narrows. And 2023 stands as the reminder that inventory discipline is the joint where the machine bends.
The forecast
For the rest of fiscal 2027, the guidance midpoint sits near CAD $4.65 billion, about 26% growth, and the panel runs ahead of it. June panel spend grew 70% against a shrinking category. The next print lands in early fall against stiffening comparisons, so reported growth should compress from 43% toward the guide. Whether the beats continue is the open issue; through June the panel has run ahead of the guidance, and that relationship is the thing to watch.
Next year the machine compounds on two tracks. The 12 to 13 new boutiques, nearly all Southern, land in each metro's dominant premium property, and digital climbs from 35% of revenue toward half. The long view is the map and the category. The store path roughly doubles the US footprint, and the spaces are getting bigger. The 25,000 square foot Flatiron building and the 40,000 square foot former Nordstrom space at Vancouver's Pacific Centre read like a new generation of the department-store anchor, one tenant and one position where a hundred brands used to be brokered. The consolidation feeding Aritzia is structural, and a share of the Closet category still in the low single digits leaves most of it still to take.
International is the next map. Today it is e-commerce only, an upgraded site shipping to 137 countries, with orders outside North America around 1% of the online business. Wong said in May 2026 that the company is focused on the US for now, and the long-range plan promised for fall 2026 will include international for the first time. Two quieter signals sit beside it, the February 2026 purchase of the Fred Segal brand and a Reigning Champ store count ticking back up, which together read like a second look at menswear.
The machine is real, and the card data is consistent with it. The risks are the watch list above, and the stock is priced for the machine to keep working. The conditions that would sustain the record are the three set out above: the promise held on price, inventory kept in line with sales, and the category continuing to concentrate. Through June 2026 the panel showed no deceleration on any of the three.
Methodology & Definitions
What the 150-million-card panel measures, how the Closet and District categories were built, and how every price, share, and geography figure was calculated.
What the panel is
Spatial.ai measures a consistent sample of United States consumer card transactions covering approximately 150 million cards. Every figure in this report described as panel data comes from that sample. Panel measurements are designed for relative comparison and trend analysis between brands, categories, geographies, and customer segments. They are not company-reported revenue, and they are not a projection of total market size.
Panel spend is gross of returns and refunds. Apparel e-commerce return rates run between 25% and 40% industry-wide, so panel dollars for any apparel brand overstate net sales by a margin that varies by channel and by brand. For that reason no panel figure in this report is reconciled to a company's reported revenue, and no panel figure should be read as an estimate of one. Where reported revenue appears, it is taken from company filings and labeled as such.
Analysis periods. Panel series run from January 2022 through June 2026 unless a shorter window is stated. Trailing-twelve-month figures run July 2025 through June 2026. Most current-catalog price figures are captured through July 2026; the adjacent-period Aritzia evidence in Exhibits 29 through 31 uses the current catalog captured August 24, 2026. Store-location figures are as of July 15, 2026. Company-reported figures are current through the FQ1 2027 results released July 9, 2026.
Exact and directional pulls. Two classes of panel extract appear in this report. Full-panel extracts, used for every level, growth rate, share, and average-ticket figure, carry the panel's full transaction history for the entities and periods named. Trailing-one-year revenue-share extracts, used for segment composition, income composition, and age composition, are directional: they support statements about relative concentration and rank order, not precise point estimates. Exhibits built on directional pulls are marked observed where the underlying composition is measured directly and modeled where a household-level attribute is applied to a transaction.
Smoothing. Monthly panel series are volatile at the brand level. Where an exhibit plots a three-month trailing average, the subtitle says so. Where a single month is quoted in prose, it is the raw monthly print for that month. Both conventions appear in this report: Aritzia's June 2026 Closet-category share of 4.4% is the raw monthly print, and the three-month average for the same month reads 3.8%. Southern-share figures are quoted on the three-month average. Comparisons should be made within a convention, never across the two.
Suppression. Cells below the panel's minimum reporting threshold are suppressed rather than estimated. Where a market, segment, or brand does not appear in an exhibit, the most common reason is suppression, not a zero.
Currency
Company-reported figures stay in the currency the company reports. Aritzia reports in Canadian dollars, written throughout as "CAD $951 million." Every panel figure and every chart built on panel data is in United States dollars. Where a company figure is set against panel data, the conversion is stated at the point of use. Growth rates are carried as reported and are not re-based to a common currency.
Categories and denominators
The Closet category is a set of 29 brands admitted on three tests: the brand's own customer base resembles Aritzia's across wealth, age, and neighborhood type by a wide margin over the broader market; Aritzia's customers measurably spend there; and the brand sells what Aritzia's customer wears. Membership was frozen in July 2026 and is held constant across every period shown. The full roster and the membership tests are in the category workpaper.
The District category is the 22-brand subset of the Closet category that also operates stores within two miles of Aritzia's United States boutiques.
Closet share is Aritzia's United States panel spend divided by the combined United States panel spend of all 29 Closet-category members, monthly. It is a share within a defined comparison set. It is not company-reported revenue share, not share of the United States apparel market, and not share of women's apparel.
Pair wallet share is Aritzia's spend divided by the combined spend of Aritzia and one named rival, measured among the customers who shop Aritzia. It describes how a fixed group of Aritzia customers divides spending between two brands. It is not total market share, and the 27 pair series are not additive.
Segment revenue share describes the composition of Aritzia's recent measured panel sales by PersonaLive segment. It is not category market share within that segment. PersonaLive segments are described in this report by their real-life household definitions rather than by label alone.
Channel
Online and in-store transactions are classified at the transaction level by the panel. A brand's online share in the panel will not match its reported digital penetration, because the panel measures card activity gross of returns while the company reports net revenue, and because the two use different fiscal calendars.
Prices
Price figures come from a brand-site archive of captured product pages, not from the panel. The report distinguishes recurring-style measures from captured-assortment measures and does not treat one as the other.
Matched-item change compares the regular list price of the same exact style observed in two periods. Exhibits 29 through 31 use adjacent analytical nodes rather than heterogeneous first-to-latest spans.
The Exhibit 29 adjacent-period index chains four exact-style links rather than requiring one style to survive the full span. For 2022 through 2025, each exact master contributes its nearest eligible USD regular-list quote to a March 10 target inside a plus-or-minus 92-day window; an exact tie selects the earlier quote. The current node is the 1,668-master eligible exact-price set from the August 24, 2026 catalog, not all 1,777 current masters. Each bilateral link retains only exact master IDs observed at both nodes, rejects any pair less than 183 actual days apart, gives one vote to each eligible master, and takes the geometric mean of its price relatives, the Jevons index. The four relatives are then multiplied. Link populations change and their counts must not be summed or described as a continuously balanced panel. The calculation performs no foreign-exchange conversion, sale-price substitution, imputation, or fuzzy identity matching.
The Exhibits 30 and 31 recurring-style comparisons use the same five nodes and four adjacent exact-style links. Exhibit 30 reports whether each exact integer regular list price rose, was unchanged or fell, then contrasts recurring-style stability with untrimmed equal-master captured-category averages at the March-centered 2022 and August 24, 2026 nodes. Exhibit 31 pools the 1,085 adjacent comparisons across those links, spanning 893 unique masters, and shows stability by core subbrand family and garment group. Price-blind group membership is required at both endpoints. One exact master can appear in more than one interval, subgroup rows overlap and are not additive, and the figures are style-link observations rather than a balanced panel. Historical observations are incomplete nonrandom archive samples, and the current endpoint excludes masters without one exact price. The captured-assortment difference therefore combines assortment and capture composition; it is descriptive and is not a causal assortment decomposition.
Catalog snapshot describes the mean or median price across the styles orderable on a given date. It moves with assortment mix as well as with price, and it is not a same-item inflation measure. Every catalog-snapshot exhibit says so in its subtitle.
Regular list price is separated from sale price throughout, and Aritzia promotes off list, so the price a customer pays is often below the tag. Exhibits 29 through 31 and the current-catalog exhibits use United States storefronts in United States dollars. Style counts and capture periods appear in the exhibits. Three limitations are material: the styles available to match change at every adjacent link; pooled comparisons can repeat a style across links; and the Q1 2025 node is not a full-year catalog. Peer archive price comparisons are excluded because the available peer evidence does not meet the report's comparability standard.
Geography
Rings. Household composition around stores is measured inside a three-mile residential radius of each boutique. A residential ring is not a trade area. It describes who lives nearby, not who shops there, and this report uses it only for that purpose.
Markets. Market-level spend is measured by Designated Market Area. DMA is a media geography and does not align to metropolitan statistical areas or to retail trade areas.
Store counts. Aritzia operated 77 United States locations as of July 15, 2026, the count used throughout this report. The figure includes three outlet boutiques and counts one closure, Northbrook Court, as closed. It is a locator count on a fixed date, not a company disclosure: Aritzia reported 76 United States boutiques at the close of FQ1 2027 on May 31, 2026, and opened further doors between that date and the July capture. Both figures are correct on their own dates, and neither should be quoted without one. Competitor store counts come from official brand locators and APIs captured in July 2026 and carry the same limitation.
Evidence terms
Modeled household traits describe areas and probabilities. They are not verified characteristics of any individual.
Causation
Comparisons of spending before and after a store opening in this report are uncontrolled. Markets were selected after the fact, one of the four received a second boutique inside the observation window, and no matched control group was constructed. Those comparisons are presented as evidence that a pattern is consistent across the markets examined. They are not evidence that the openings caused the change, and this report does not claim a lift figure. Establishing one would require a matched-control or difference-in-differences design, which is outside this version's scope.
The same restraint applies to the associations drawn between category density and store performance, between segment composition and brand positioning, and between price discipline and share gain. Each is a documented association with a stated mechanism, not a measured causal effect.
Disclosures
As-of dates, corrections, independence, and the limits of panel data.
As-of dates. Panel data in this report runs through June 30, 2026. Most current-catalog price captures run through July 31, 2026; the adjacent-period Aritzia evidence in Exhibits 29 and 30 uses the eligible exact-price set from the current catalog captured August 24, 2026, while Exhibit 29's Bureau of Labor Statistics comparators run through July 2026. Store locations were verified July 15, 2026. Company-reported figures are current through Aritzia's FQ1 2027 results, released July 9, 2026.
Figures change after publication. Aritzia opened boutiques while this report was being written, and it has announced more. Store counts, market lists, panel levels, prices, and company-reported figures stated here are correct as of the dates above and will not be correct indefinitely. Counts of locations in particular move several times a year: the company reported 76 United States boutiques at its May 31, 2026 quarter-end, and the July 15, 2026 locator count used here is 77. Any figure quoted from this report should carry its as-of date. Where a reader needs a current figure, the underlying series are refreshed monthly and a corrected figure is available on request.
The asterisked section. The Category & Climate section marked with an asterisk, The limiting factor, is the analysis in this report most subject to change, because its inputs are set by United States and Canadian trade policy. Tariff levels, exemptions, and the companies' sourcing responses were moving while this report was written and will keep moving after publication; read that section against the policy in force on the day it is used.
Corrections. Errors of fact are corrected in a revised version with the change noted. The correction route and the accountable contact are on the back page.
Panel caveat. Spatial.ai panel sales represent a consistent sample of United States transaction activity and are intended for relative comparisons and trend analysis. They are not company-reported revenue.
Sources. Company figures are drawn from Aritzia Inc.'s public filings, releases, and management commentary. Market and property statistics are attributed at the point of use. Where sell-side or bank research is referenced, it is attributed generically in the body text; specific firms and reports are recorded in the internal source index and are not reproduced here.
Independence. This report was prepared by Spatial.ai using its own panel and publicly available material. Aritzia Inc. did not commission it, review it, or supply data for it. Nothing in this report is investment advice, an offer, or a solicitation, and no part of it should be relied on as a recommendation to buy or sell a security.
Images. Product and storefront photography is reproduced from company and press sources for identification and commentary. Trademarks are the property of their owners.
Apply this analysis to your brand
Every figure in this report came from the same panel and the same method, applied to one brand. The same readout can be run for yours: customer composition, competitive spending, price position, and where the next locations should go.
Want these insights for your brand?
Discover customer composition, competitive spending, and market opportunity for your brand with the panel behind this report.