
What PersonaLive reveals about Aritzia’s Urbanist customers
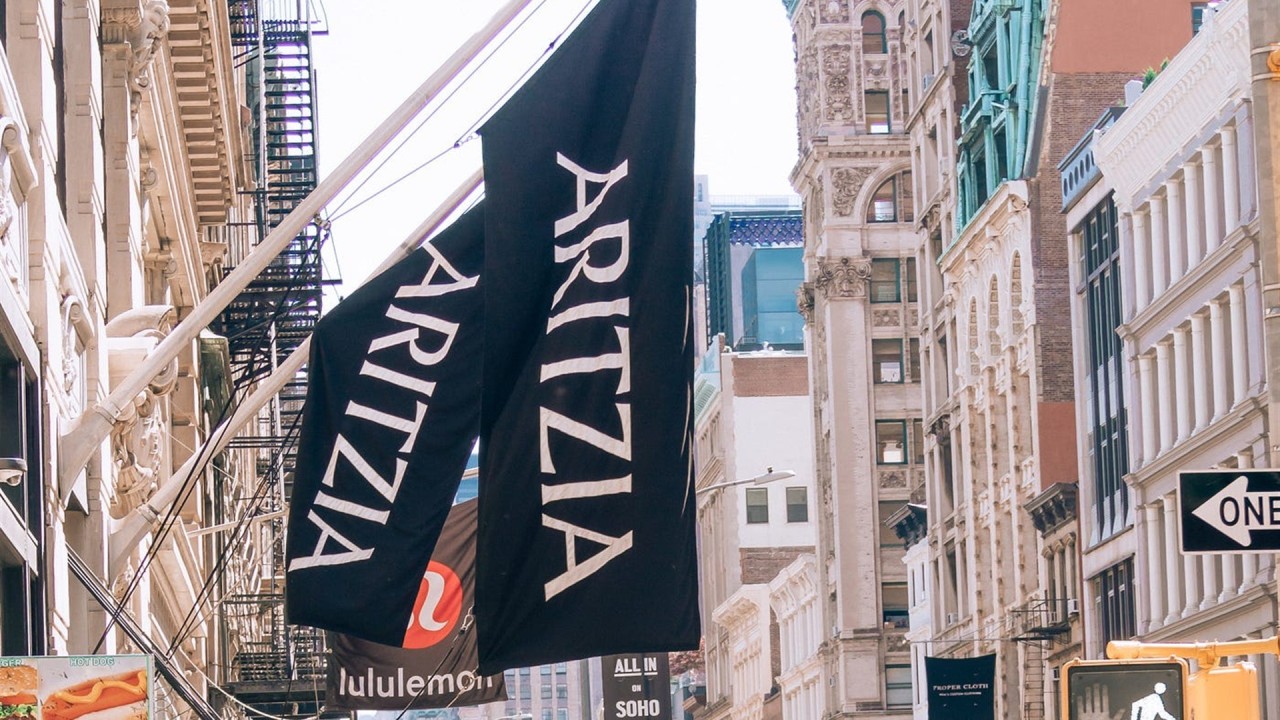
PersonaLive adds a household-level view of the audience behind Aritzia’s Everyday Luxury positioning. Urbanists, a segment of predominantly young, educated urban households, stand out in the brand’s spending mix.
The behavior
California Urbanists over-index on visits to Aritzia, Saint Laurent, Chanel, and Louis Vuitton. Aritzia has substantially higher household purchase penetration within the segment.
In the trailing 12 months to June 2026, 2.4% of California Urbanist households purchased from Aritzia, compared with 0.1%–0.6% across the three luxury brands.
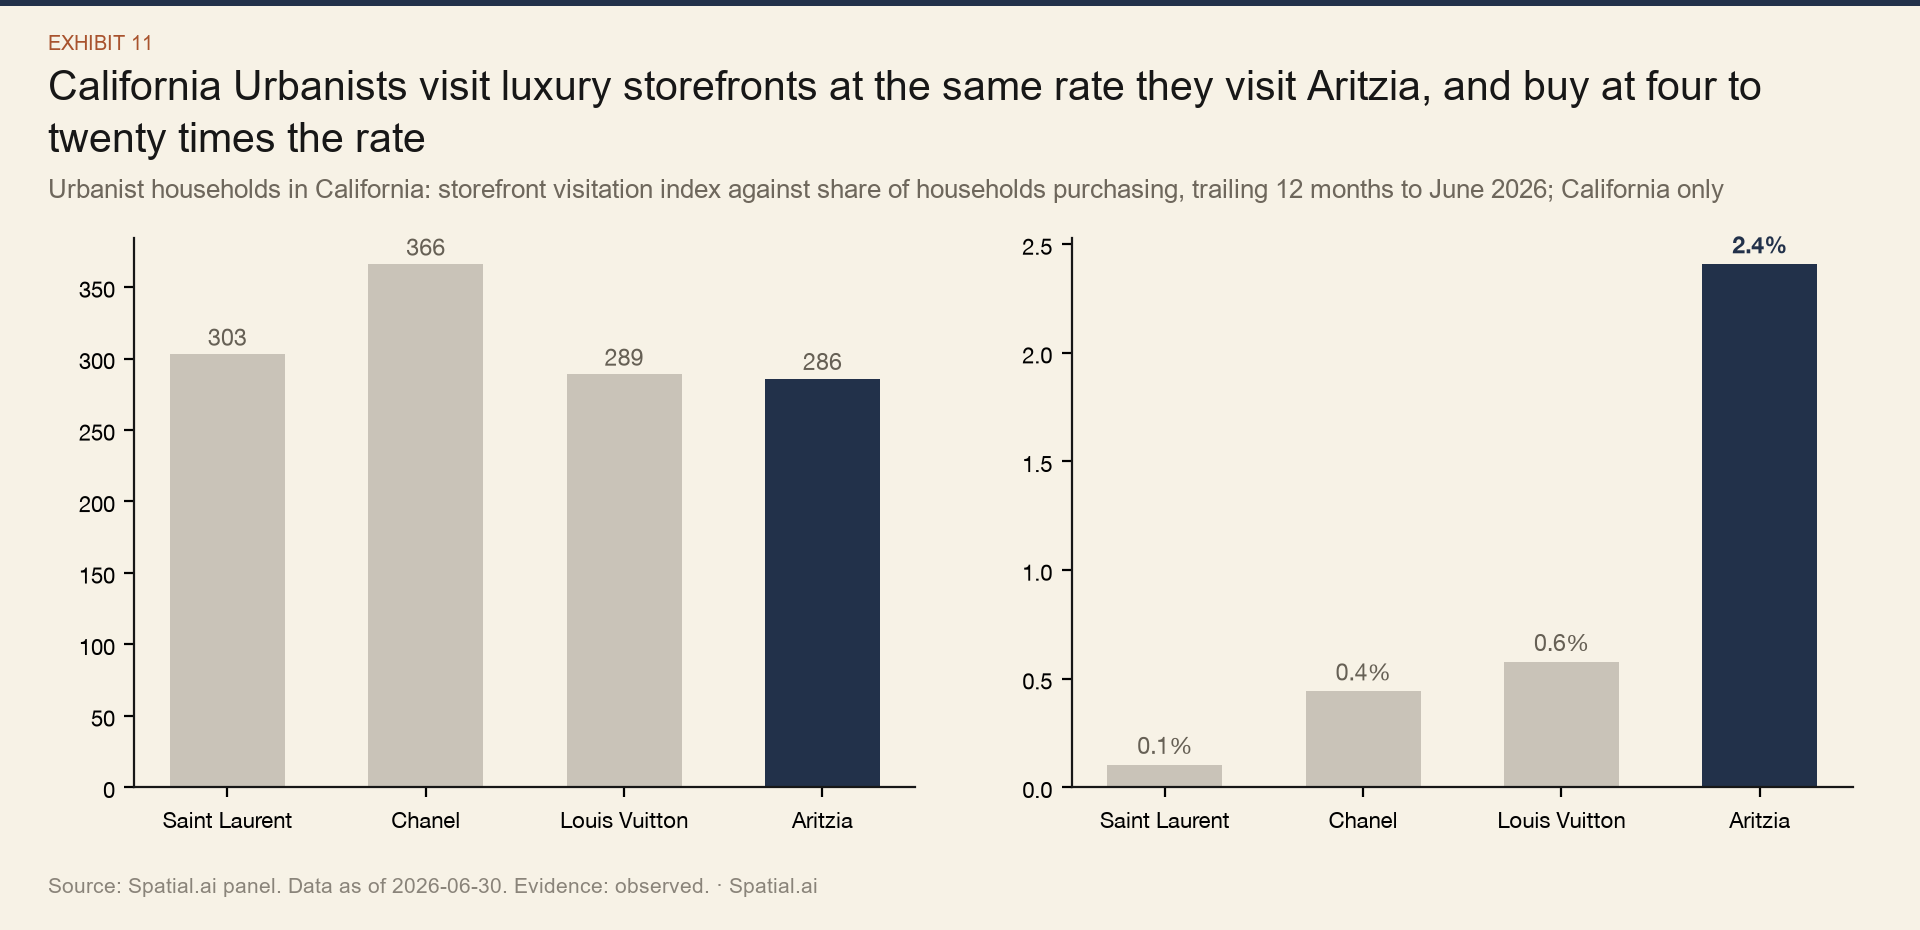
The pattern is consistent with Aritzia’s Everyday Luxury positioning. These are separate segment-level measures of visitation and purchasing; they do not track an individual journey from browsing a luxury store to buying at Aritzia.
The profile
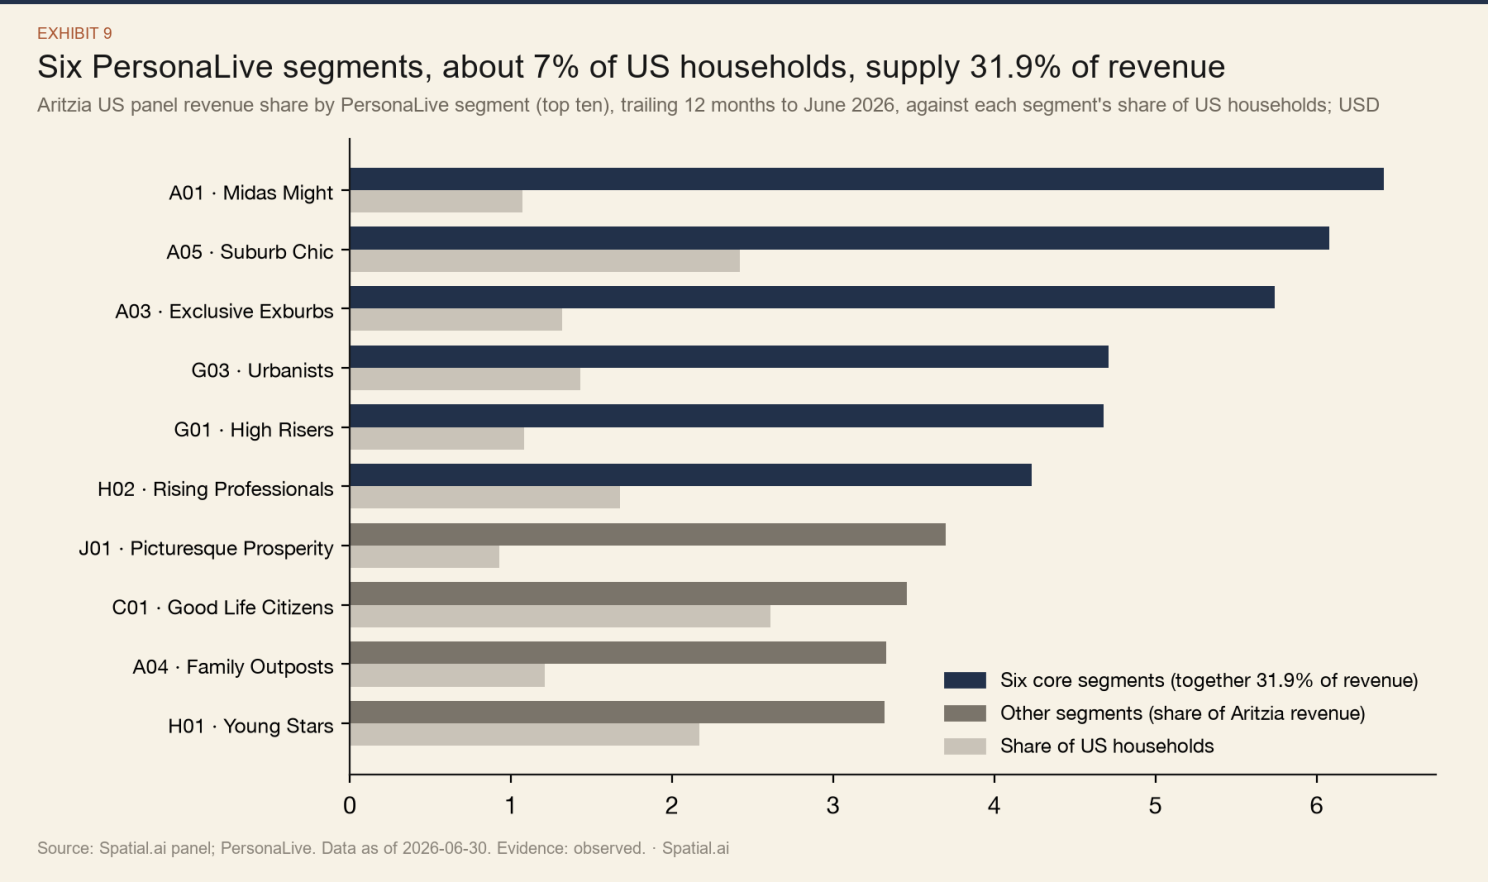
Urbanists comprise about 1.8 million U.S. households, roughly 1.4% of the country’s households, and account for nearly 5% of the Aritzia spending observed in the U.S. panel. This is one concentrated segment within a broader customer base.
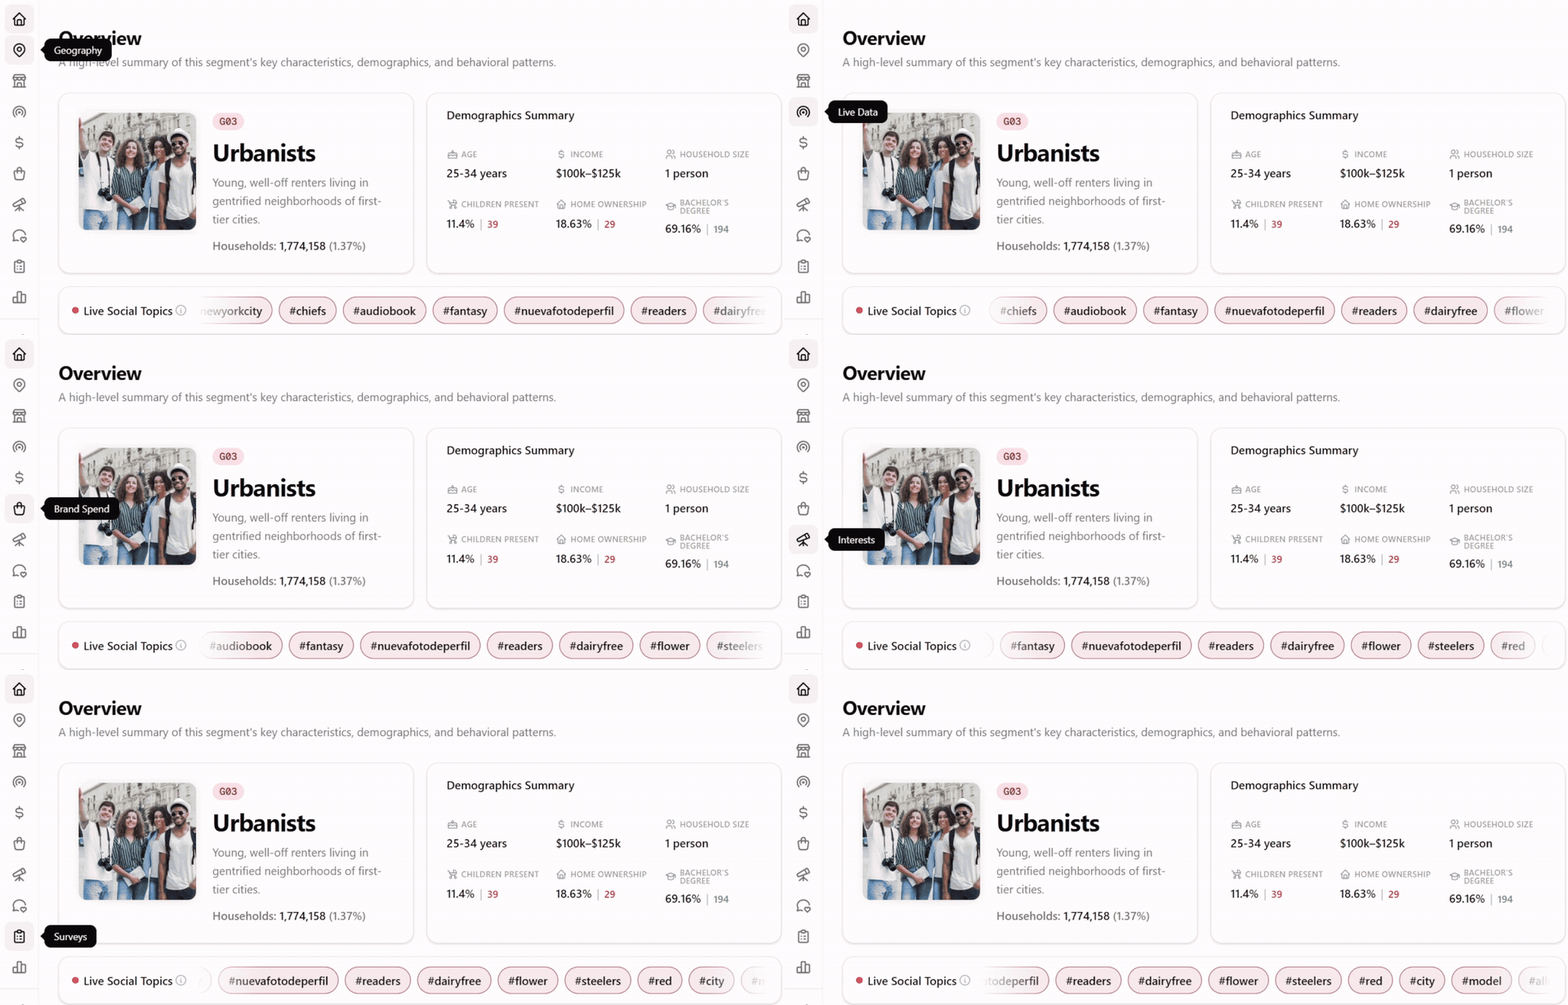
PersonaLive brings the segment’s household profile, attitudes, spending, and visitation measures into one view.
The attitude
Among Urbanist survey respondents, the following shares rated each priority at least somewhat important, compared with the U.S. benchmark:
These figures combine somewhat, very, and extremely important responses. They describe the Urbanist respondents, rather than all Aritzia customers, and are separate from modeled platform overview measures.
The locations
In the Bay Area, four of the five boutiques shown overlap modeled Urbanist residential concentrations: San Francisco, Palo Alto, San Jose, and Walnut Creek. Corte Madera sits outside that pattern, in an area associated with affluent family households.
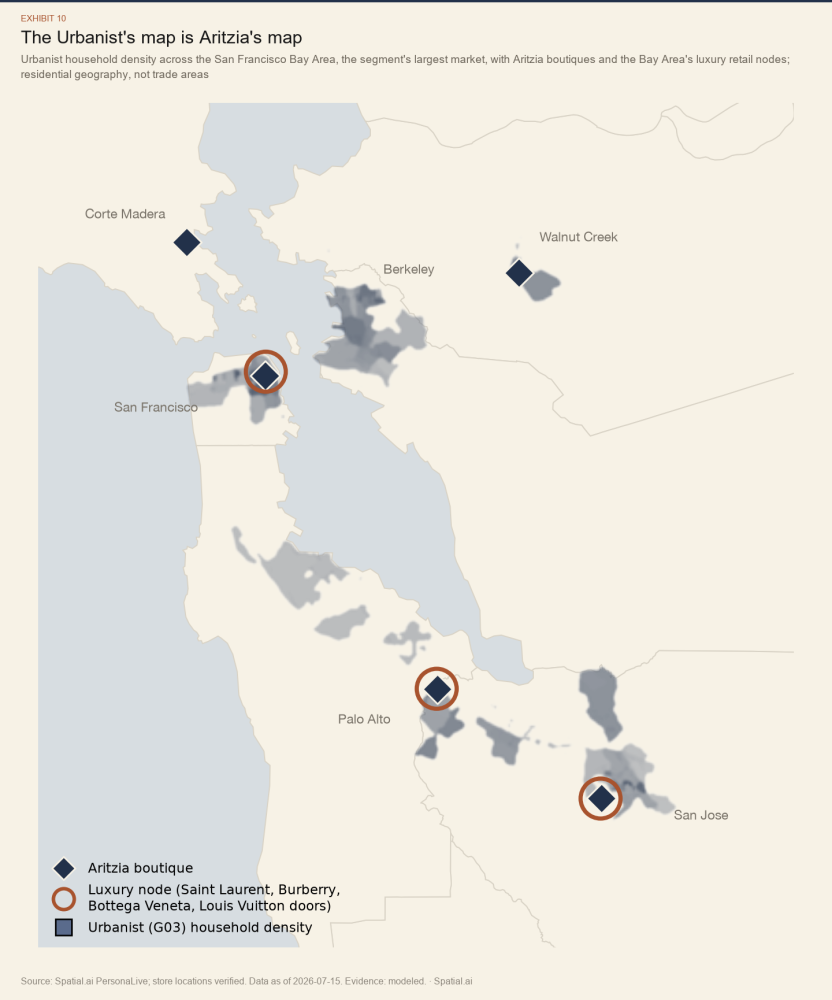
The overlap supports evaluating customer concentrations alongside store locations. It does not establish who shops at each boutique or why Aritzia chose those sites.
PersonaLive maps segment concentrations alongside available brand locations to support market and site evaluation.
Aritzia’s Everyday Luxury positioning
The Urbanist profile combines interest in status-associated brands, elevated visitation affinity, and greater household purchase penetration at Aritzia than at the luxury brands compared. Together with residential geography, those measures help describe one audience for Everyday Luxury.
The analysis illustrates how retailers can compare brand affinity, purchasing, and residential concentration when evaluating customer positioning and locations. The full Aritzia report extends the analysis to customers, competition, and geographic strategy.
Sources and scope
Spending: Spatial.ai’s PersonaLive Spend analysis uses Affinity Solutions’ card panel, described in the product documentation as covering approximately 150 million cards. That figure is overall panel coverage, not the sample size for the Urbanist comparisons. Panel spending is gross of returns and is not company-reported revenue. Segment spending shares are directional.
Periods and geography: the registered spending and California behavior analyses cover July 2025–June 2026. The national household estimate comes from the August 31, 2026 PersonaLive capture; store locations are dated July 15, 2026. The approximate household and spending shares therefore use separate source dates and denominators. Visitation indexes retain the source benchmark of 100 and do not measure equal traffic volumes.
Profile and survey: age refers to household heads. Education retains PersonaLive’s reported incidence label; the income description does not impose a median or mean label. Attitude percentages use the recorded respondent-only response tables and the threshold stated above. The available source notes do not include survey sample sizes, fieldwork dates, or weighting details. Household attributes and residential concentrations are modeled; the spending, visitation, survey, and location measures have distinct sources.
#CustomerIntelligence #RetailStrategy #ConsumerInsights #Aritzia
Want these insights for your brand?
Discover customer composition, competitive spending, and market opportunity for your brand with the panel behind this report.