
February 16, 2018
Last updated
min read

In April 2017, a low-price shoes franchise, declared bankruptcy and made plans to close the door to 400 underperforming stores, a whopping 10% of their total existing stores. Within months, the number of proposed closings more than doubled. A flurry of articles began publishing lists of which stores were closing and which were remaining open, so shoppers could plan accordingly.
Always curious about why some brick and mortar stores work and others don’t, we began to examine the lists. Right off the bat, we discovered something interesting regarding their locations: for almost every store that was closing, another 1-2 stores in the same market stayed open. Sometimes, they were within several miles of one another.
In Long Beach, California, for example, a store on West Willow Street closed its doors. Just 2.6 miles down the road, another store stayed open.
.png)
In Bangor, Maine, same story: 2.3 miles separated the store that survived from the one that didn’t.
.png)
This happened in large cities too, like Chicago:
.png)
So what made one perform so much better than another? Why did the majority of consumers shop on one block instead of the one two miles up the road? And why didn’t this brand have the data to predict those discrepancies in the first place?
Not all of these questions can be answered. We don’t know, for example, why this brand didn’t make accurate predictions—or whether they did, but the changing landscape of brick and mortar impacted them in unexpected ways. We do, however, know that site location success depends on understanding a market at a neighborhood level. We’ve proven mathematically that neighborhood-level social media data can forecast revenue. And as the leading provider of location-based social media data analysis, we wanted to find out if we could reveal this brand's underperforming stores.
For a little background, it’s likely helpful to know who we are and how our analysis works. We’re a location data company that uses conversations from social networks to understand how humans move and experience the world around them. Any one business can come to us and request a “data evaluation.” We then use revenue to benchmark which of their locations are “best” and which are “worst” according to our social media data. This allows us to determine the optimal predictive blend of our proprietary 550 machine learning-enhanced social categories to identify which individual categories have the most positive—or negative—impact on revenue.
Once those categories are established, we can generate custom Social Indicators, kind of like a unique thumbprint that we can look for in any prospective site to forecast how well their business would perform (the likelihood of operating below or above their average revenue level, and to what extent).
Our formal hypothesis, then, was that this brand's underperforming stores would receive significantly below-average custom Social Indicator scores, as compared to their nearby, performing counterparts (and the franchise as a whole). If this is true, then Spatial.ai’s analysis of social data could be used to help identify future locations for stores and minimize the likelihood of underperformance.
To begin testing our hypothesis, we decided to treat this brand like we would any client, even though they were not a client at the time of this project. First, we procured a public list of the first ~400 stores to close and ~600 locations they did not close in the same markets (in the end, they closed 637 total). We also made the assumption that when they said they were closing “underperforming” stores, that performance was tied to revenue.
Then we removed a test set of the locations and kept their status—closing or remaining open—unknown.
Next, we conducted an initial data evaluation of the remaining stores on our list (the training set) to discover the social categories optimal for this brand. Not only is this crucial quantitative data for generating accurate custom Social Indicators, but it also provides qualitative insights that begin to tell a story about where this brand can find site selection success.
In this case, the following qualities of social media most heavily impacted the success of their stores, either positively or negatively:
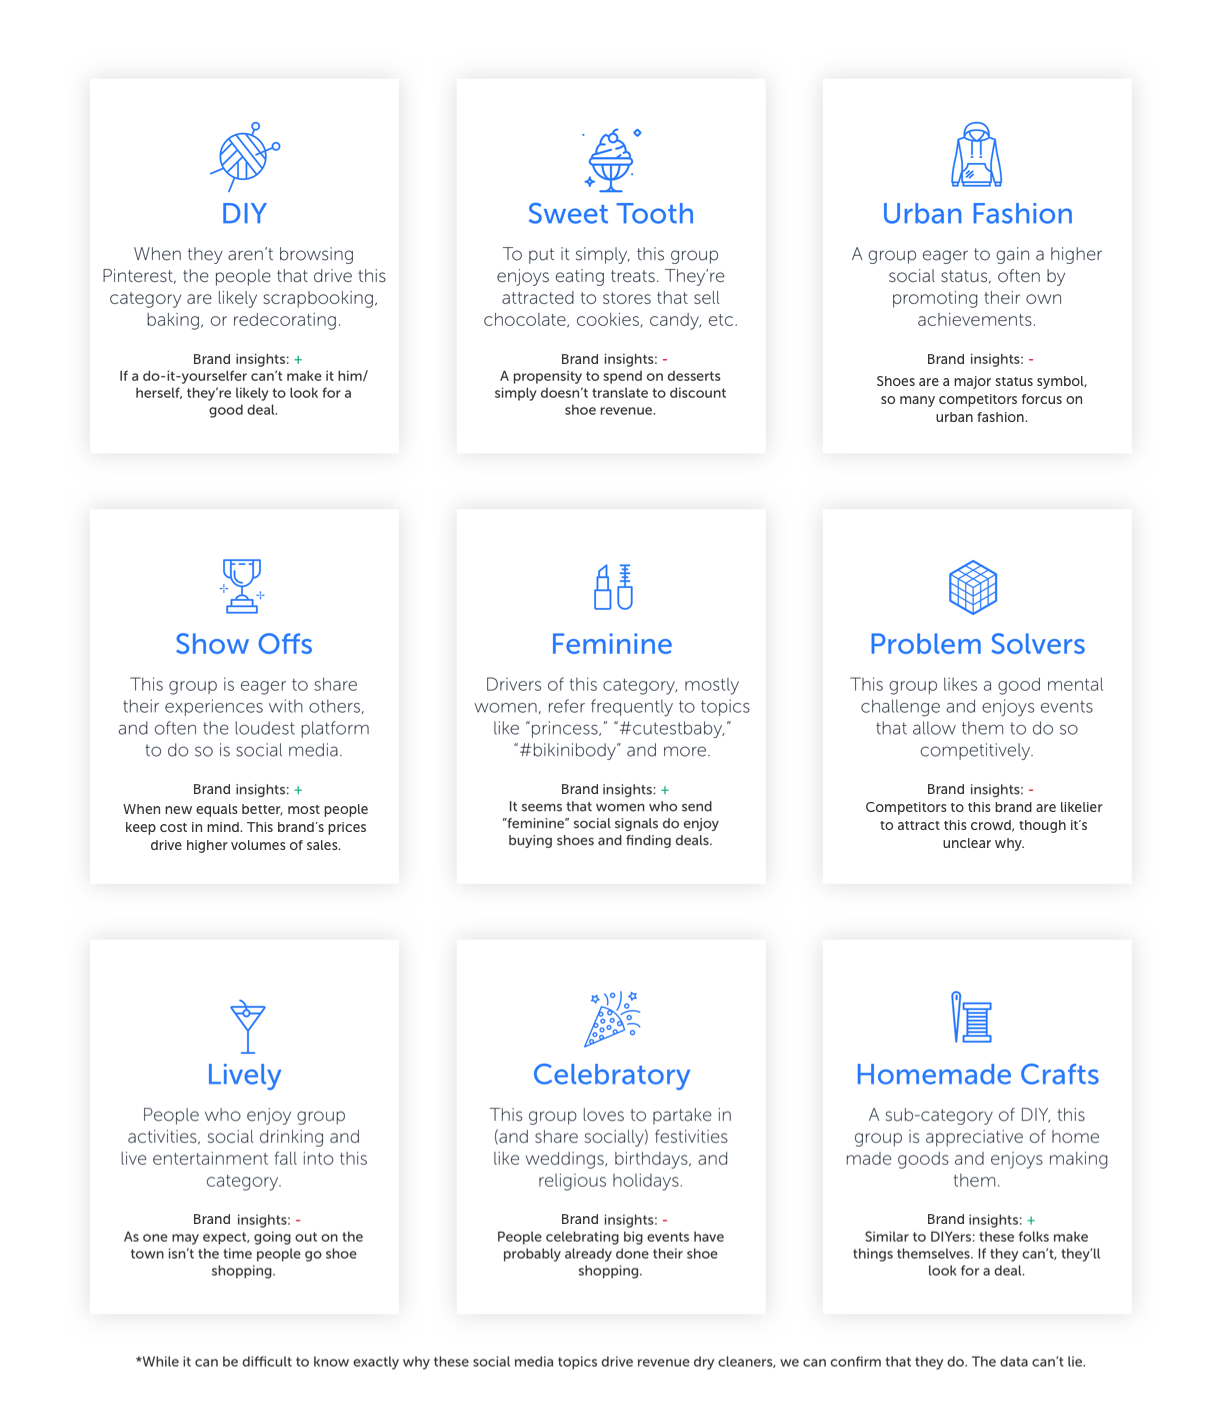
Some of these insights are surprising. Who could have guessed, for example, that a neighborhood where Sweet Tooths were active would be a negative signal for discount shoe retailer stores? Yet, out of 550 categories, this is one of the nine most impactful. On the other hand, it makes sense that crafty people may tend to be thrifty, women (especially those exhibiting more stereotypically Feminine signals) and people who go out frequently may desire to have more shoes, and those who care about Versace (in the Urban Fashion realm) are likely going to consider this brand “generic.” A story begins to unfold about who is shopping for discount shoes, and where.
Of course, the goal of these insights is to drive the data model, unique to this brand, that can determine a custom Social Indicator attributed to any one site and accurately predict whether or not that site will result in above-average sales.
So after identifying the custom social categories most applicable to this brand, we got to the most important part of the experiment: we ran our model on the remaining 20% of the store locations to generate custom Social Indicators for every site and see if they accurately predicted which of those were closed or remain open.
Our discovery: Spatial.ai successfully quantified the emotional variables of thsi brand's locations. Better yet, this social media data alone was 82% accurate in predicting which location would close.
*Typically for clients, we would use insider data (not public) to achieve a higher accuracy, Additionally, we deliver customs report for any prospective location.
In a nutshell, having the wrong social profile plays a significant role in performance.
Based on our analysis, the customer behavior signaled in social media data can drastically impact a retailer’s site selection success. Fortunately, this customer behavior can be tracked down to the block to provide true location intelligence. This data can’t save a franchise that’s already struggling, but it can help a retailer move forward efficiently.
Since a business not only makes money opening the right store but also loses money opening the wrong one, getting location right really matters. This brand likely used state of the art methods to select their locations. However, they did not use location-based social media data. Before Spatial.ai, the voice of social media wasn’t a part of the site selection process.
That’s a problem because much of the information needed for analysis (population, income, demographic) has to come from census data, which is updated once a decade. Other data, like movement data (e.g. traffic and mobile), purchase data, and survey data, still doesn’t capture organic conversations about exactly what kinds of experiences people are having—and where.
Social media data has been the missing voice in predicting the right site for retail. Until now.
When location-based social media data is considered as part of the retail site selection process, the true personality of each block within a market becomes a lot more evident. Knowing what that is ahead of time—and the likely impact—can change the game for retailers.

.jpeg)
%2520(1).jpeg)
